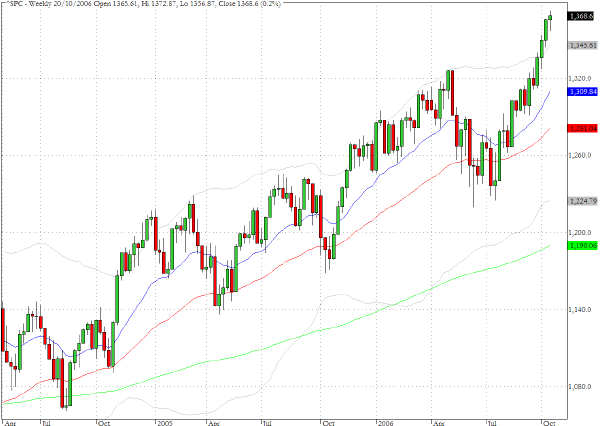
We feature some weekly charts in our review of the state of the overall equity market. The chart for the S&P 500 covers the last thirty months and highlights the very steep ascent that began in July 2006, took out the previous April high and has now propelled the index beyond the upper 50-week volatility band.
The extent of the May/July 2006 correction is clearly visible, but it is also pertinent that there was no violation of the pronounced upward channel that coincided with the weekly lows during this time frame. Also evident is the successful re-testing in July of the May/June lows but on the flip side the Friday's close is stretching the upper limit of the trendline through the weekly highs.
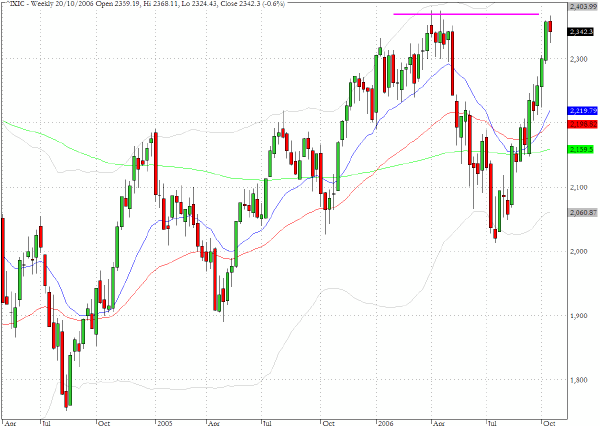
In contrast with the above chart for the S&P 500, the weekly chart for the Nasdaq Composite (^IXIC) shows that the May/July correction did violate the lower channel or trendline through the lows over the last thirty months. One cannot fail to be impressed by the steepness of both sides of the V formation over the last few months. The recovery has brought the index back to the juncture with the April high and we are about to find out whether there is enough enthusiasm to sustain the very steep ascent or whether a consolidation pattern will emerge.
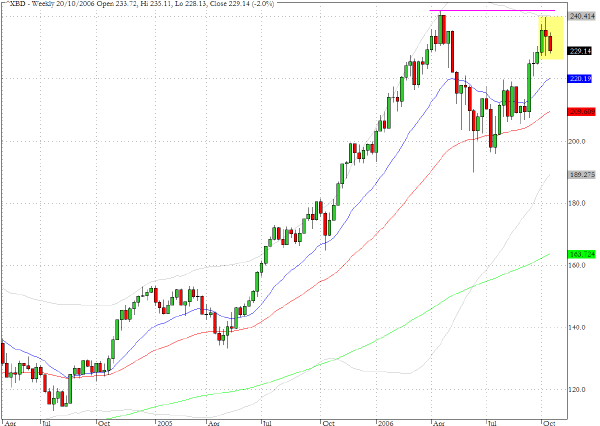
The weekly perspective on the broker/dealer sector (^XBD) shows greater similarity with the chart for the Nasdaq Composite than the S&P 500 and the sector is facing the possibility of registering at least on an interim basis a lower high than that achieved in April.
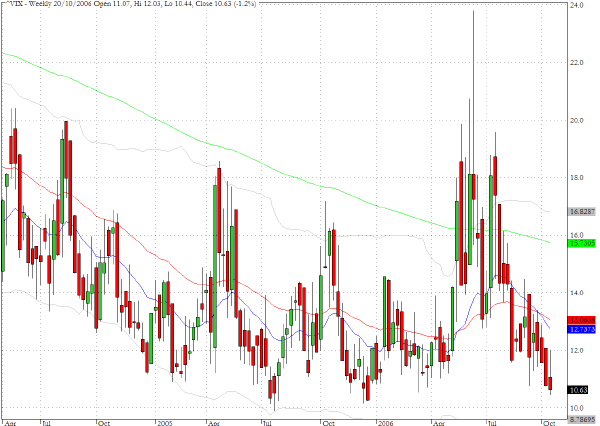
The weekly chart for the CBOE Volatility index (^VIX) illustrates the return towards the historically low levels that were experienced in the summer of 2005. The May/June 2006 episode stands out clearly as the only significant interruption in what has otherwise been a remarkably benign view by traders of equity market risk.
TRADE OPPORTUNITIES/SETUPS FOR MONDAY OCTOBER 23, 2006
The patterns identified below should be considered as indicative of eventual price direction in forthcoming trading sessions. None of these setups should be seen as specifically opportune for the current trading session.
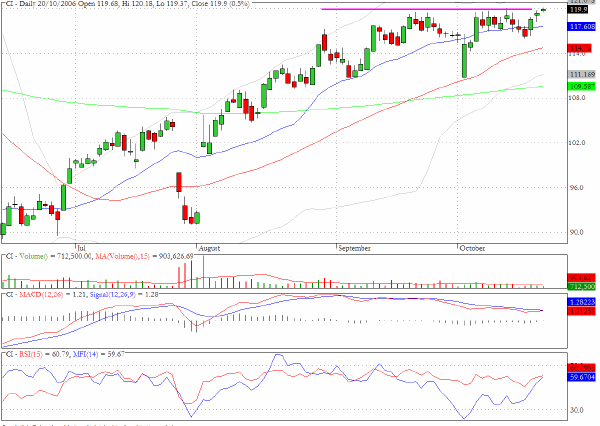
Cigna (CI) looks poised to break through the $120 barrier. There is noticeable evidence of accumulation during the recent period of sideways price action.
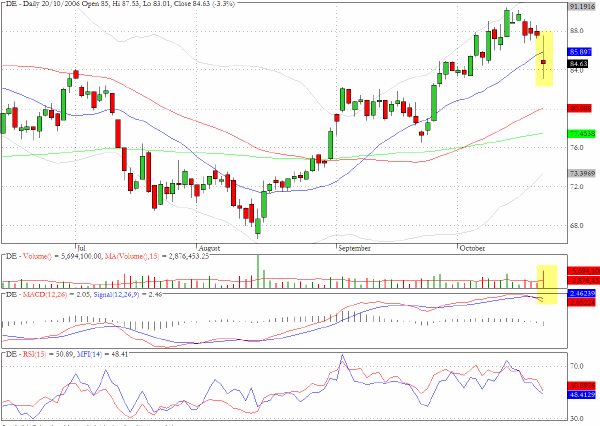
Deere (DE) slumped in Friday's trading in sympathy with the much bigger plunge that was suffered by Caterpillar following its weak earnings. The narrow body candlestick with long tails - a spinning top - suggests that there could be a re-evaluation of the specific prospects for Deere in coming sessions.
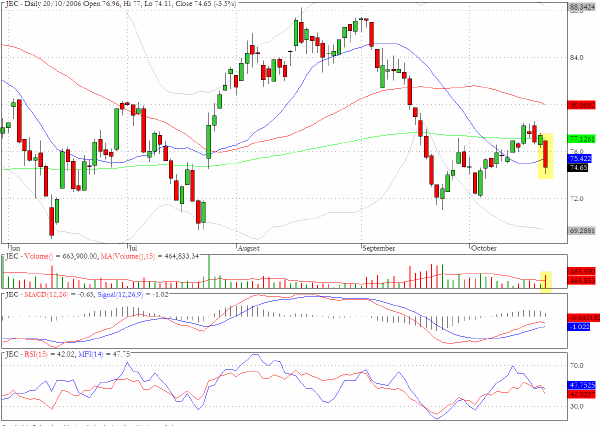
Jacobs Engineering (JEC) moved down 3.5% on Friday on substantial volume and closed below all three moving averages.
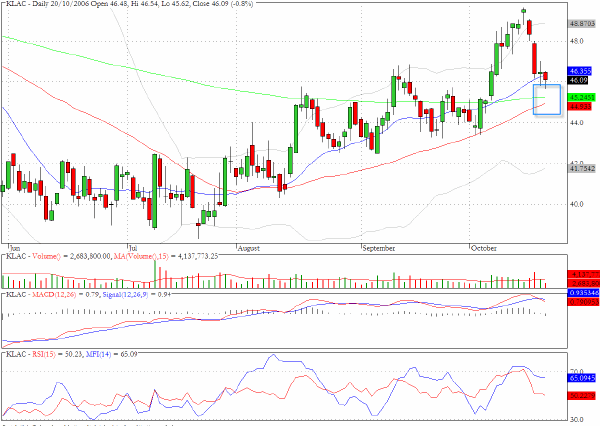
KLAC retraced much of the early October advance in last week's trading and is now approaching the intersection of the 200- and 50-day EMA's.
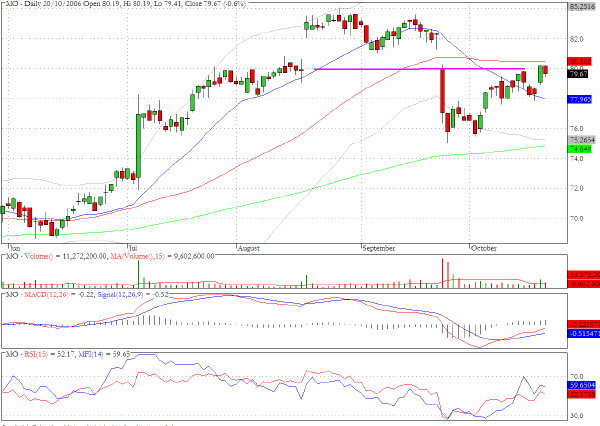
ALtria Group (MO) faces potential resistance at current levels.
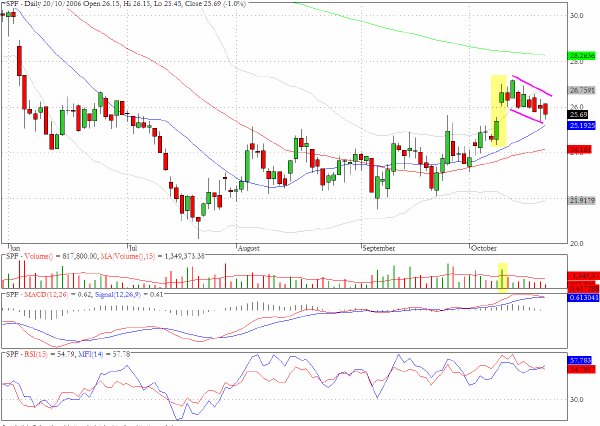
We drew attention to Standard Pacific (SPF) in conjunction with the bull flag formation in late September. Since then the stock has experienced another upward surge carving out the more recent flagpole that we have highlighted. The recent retracement pattern may be almost done and we would expect to see $28 in coming sessions.
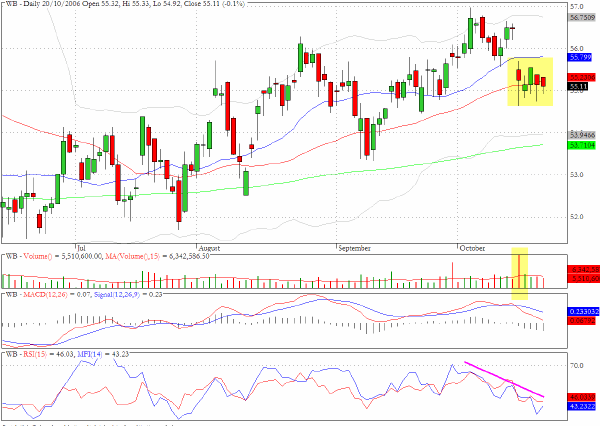
We will be monitoring Wachovia (WB) this week as there is a bearish flag formation developing in association with clear evidence of distribution.
Clive Corcoran is the publisher of TradeWithForm.com, which provides daily analysis and commentary on the US stock market. He specializes in market neutral investing and and is currently working on a book about the benefits of trading with long/short strategies, which is scheduled for publication later this year.
Disclaimer
The purpose of this article is to offer you the chance to review the trading methodology, risk reduction strategies and portfolio construction techniques described at tradewithform.com. There is no guarantee that the trading strategies advocated will be profitable. Moreover, there is a risk that following these strategies will lead to loss of capital. Past results are no guarante of future results. Trading stocks and CFD's can yield large rewards, but also has large potential risks. Trading with leverage can be especially risky. You should be fully aware of the risks of trading in the capital markets. You are strongly advised not to trade with capital.