NASDAQ COMMENTARY
Last week we saw the NASDAQ lose ground for the first time after four positive weeks. This week marks the second losing week for the composite. Again, the loss was small, but selling breeds more selling. This sustained disappointment has clinched a few more sell signals, so now with the bears getting a little more comfortable, we have to think that the index is poised to go lower before the uptrend continues.
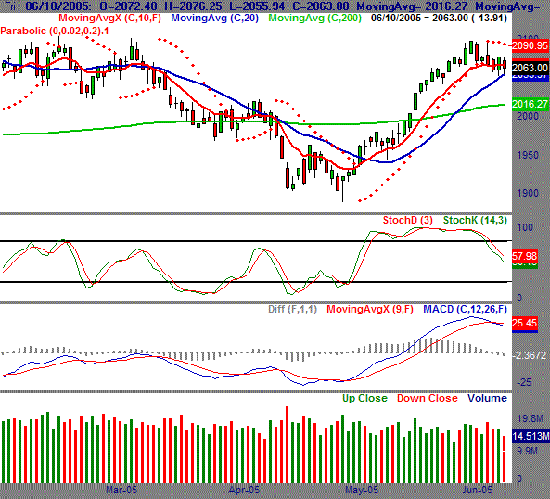
The most important bear signal we're seeing is the weekly close under the 10 day moving average (red). We actually saw this happen a couple of times during the week, but the weekly close is the most important one. Why? It really shows trader conviction; are they willing to hold stocks over the weekend...when they can't be traded? In May, the answer was yes. Over the last two weeks, the answer has been no. The 10 day line is currently at 2067, while the NASDAQ closed at 2063.0.
But there's more. We're now into our third day of a complete stochastic sell signal, and also three days into a MACD sell signal. So far, both have been generally accurate, although both are still young too. We've also added a Parabolic Stop-And-Reversal (SAR) indicator this week. Those are the red dots you see above and below the NASDAQ's bars. As of Monday, the SAR markers switched from below to above the NASDAQ's bars. That's a sell signal that has been a little too accurate recently to ignore. Were it just one of these signals or the other, we'd be able to dismiss them based on May's bullishness. But when all the key signals are starting to stack up, you have to interpret them as they appear.
The last line of defense is the 20 day line (blue). The composite found support there all week, and it may continue to do so in the coming week. From a risk-to-reward perspective, there's not much advantage to going bearish (selling short) now until the NASDAQ breaks under that line. It will be another key sell signal, and it's only at 2056, or 10 points under the NASDAQ's close.
NASDAQ CHART

S&P 500 COMMENTARY
The S&P 500 was in the red the two weeks ago too, but unlike the NASDAQ, the S&P actually made a small gain this past week. The close at 1198.11 was two points higher than the previous week's close. We first started seeing hints that the SPX would fare better than the NASDAQ last week, when the tech-heavy index lost by a much greater degree than this large-cap index. But then again, the NASDAQ had much more to lose after a major breakout in May; the S&P 500 never really had that runaway breakout.
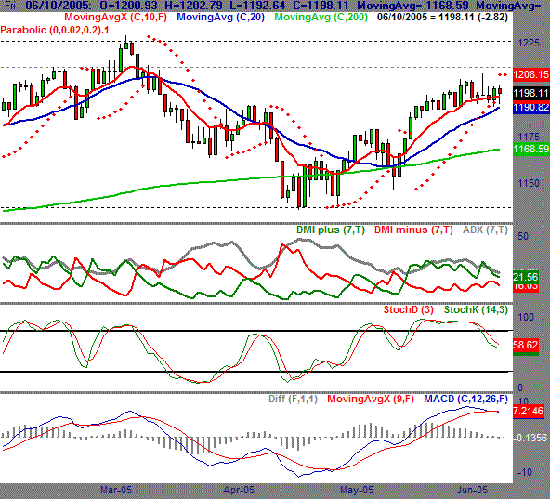
In any case, despite the gain, the S&P 500 still looks more bearish than bullish. Like the NASDAQ, a couple more sell signals were checked off. For instance, we can now see a bearish MACD crossunder (as of Thursday), and we're now three days into a stochastic sell signal. We've also seen the parabolic SAR sell signal for the SPX too. If this recent weakness is just a little volatility, it sure is showing us a lot of bearish clues.
That said, having a little bullish faith in the S&P 500 isn't completely unjustified. The index is still above its 10 day line (red), and hasn't really even tested the 20 day line (blue) as support. So from that perspective, the uptrend is still technically intact - we just don't think it will stay that way for a whole lot longer. We're now making more lower highs than we are higher highs. As for lower lows, it looks like there's some mild support taking shape around 1192, near the lowest of the lows over the past couple of weeks. That's also where the 20 day line will be early next week, re-enforcing that support level.
For that reason, although we're in the bearish camp, we're going to wait and see what happens over the next couple of days before becoming more bearish (adding more short trades). If we close a couple of times under the 20 day line and/or 1192, that should sufficiently ignite some more selling and push stocks firmly lower. After all, all the other sell signals are already in place.
S&P 500 CHART

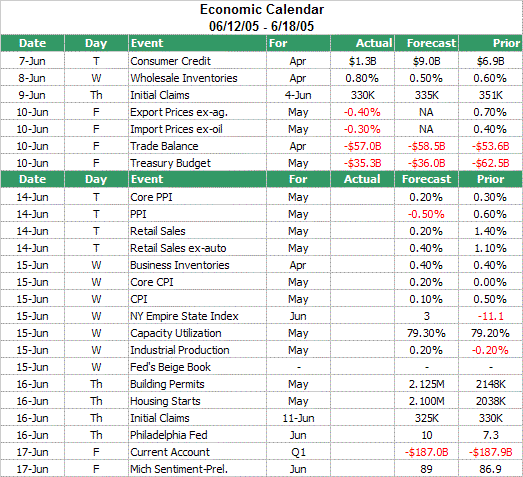
ECONOMIC CALENDAR

BOTTOM LINE
This coming week is an expiration week, and if it's like most of them, it will be choppy, but uneventful when it's all said and done. So, don't get frustrated if the downtrend doesn't continue or the market doesn't bounce. As we mentioned above, the indexes are at support lines right now, so waiting a couple of days to see where it all goes may be a wise move. But, like we also said, the odds favor more bearish action than bullish pressure.
Price Headley is the founder and chief analyst of BigTrends.com.