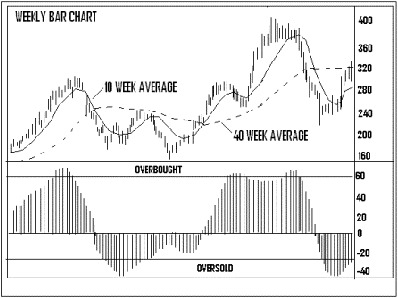
An oscillator can be constructed using two moving averages. Two moving averages are utilized by stock traders to generate buy and sell signals when the shorter average crosses above or below the longer average. Crossing above the longer average generates a buy signal and crossing below, a sell signal. The oscillator chartdiver is constructed by plotting the difference between the two averages as a histogram. The histogram bars will extend from the zero line and appear as a plus or minus value. There are three uses for this oscillator:
- To help spot divergences
- To help identify short term variations from long term trend (when the shorter average moves too far above or below the longer average)
- To pinpoint the crossings of the two moving averages, which happens when the oscillator crosses the zero line.
The shorter average is divided by the longer one, but the longer average is essentially the zero line because the shorter average oscillates around it. The oscillator is positive when the shorter moving average is above the longer, and negative when the shorter average is below. See the rough graph below for an example.

When the two moving average lines move too far apart, it causes a market extreme which will call for a pause in the trend. Most often, the pause or stall in the trend will not end until the shorter average moves back to the longer line. As the shorter line approaches the longer moving average, a critical point is reached. For example, when the shorter line dips back to the longer line in an uptrend, it should bounce off the longer usually denoting an ideal buying area. This situation is very similar to testing an up trendline. However, if the shorter average crosses below the longer one, a trend reversal is signaled.
In a downtrend, should the shorter average rise to meet the longer line, it will most likely signal an ideal selling area, but if the shorter crosses above the longer, look for a trend reversal. Not only is the relationship between the two averages an excellent trend-following system, but it also helps identify short term overbought and oversold conditions.
Andy Swan is co-founder and head trader for DaytradeTeam.com. To get all of Andy's day trading, swing trading, and options trading alerts in real time, subscribe to a one-week, all-inclusive trial membership to DaytradeTeam by clicking here.