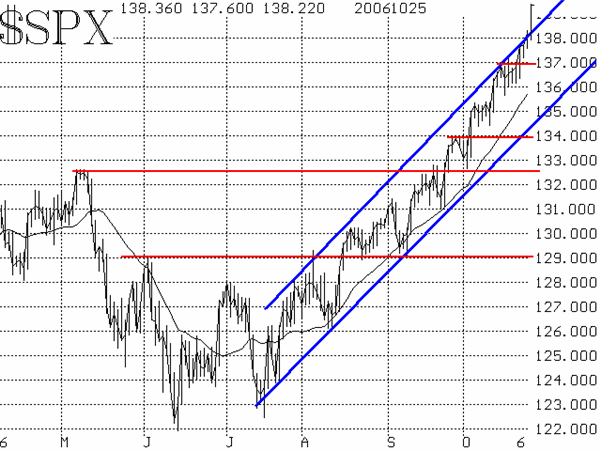
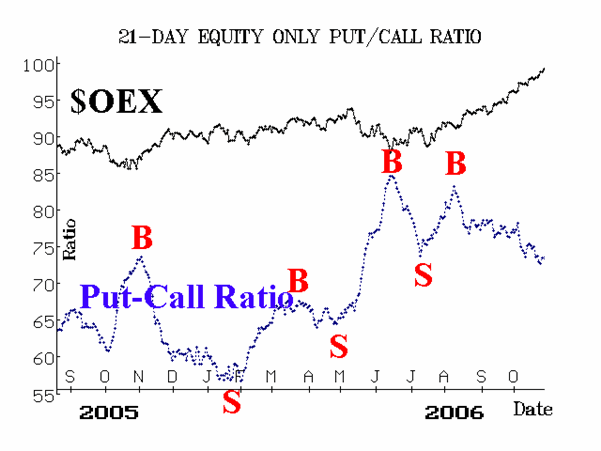
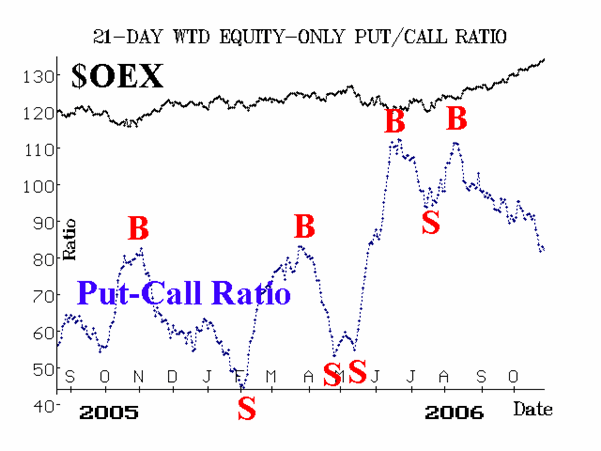
Once again, the trend remains positive, as the technical indicators have correctly refused to give sell signals. If you look at the chart of $SPX (Figure 1), you will see just how uniform its increase has been since the July bottom. The same effect can be seen on the equity-only put-call charts (Figures 2 and 3). While this uniform rise in $SPX has been taking place, the technical indicators have more or less remained static at least for the last two months. This continues to produce a market that is short-term overbought and intermediate-term bullish. As is obviously the case, a market can continue to rise while it is overbought. It's only when actual sell signals arise that one would want to alter the bullish stance, and that has not yet happened.

$SPX has created many support levels on its way up: 1360, 1340, 1325, and 1290 stand out as the major ones. These should mitigate damage during corrections -- and also act as more serious warnings signs should they give way during any correction. At this point, we can't predict a correction, but one can materialize quickly. Take 1997 as a case in point: the market had been rallying during most of October, but then in 4-1/2 trading days, $SPX fell a whopping 117 points, before turning around on the last day. Within a month, it was at new highs, but the damage done by such a swift and deep correction was catastrophic to some. Hence, when we say that severe overbought conditions can produce swift, but short-lived corrections, it might sound rather benign. But it isn't. So it's important to take partial profits, roll your options up, and keep tightening your trailing stops as this market continues to rise.

The equity-only put-call ratios are bullish. You can see from Figures 2 & 3, that they both made new relative lows recently. A downtrend in the put-call ratio is bullish. While some of the other broad-based ratios are getting quite overbought, these two stalwarts are not as they remain fairly high on their charts. Hence, these are intermediate-term bullish.

The most overbought indicators are market breadth and volatility indices. Breadth (advances minus declines) continues to be positive on most days, and has resided in overbought territory for quite some time now.
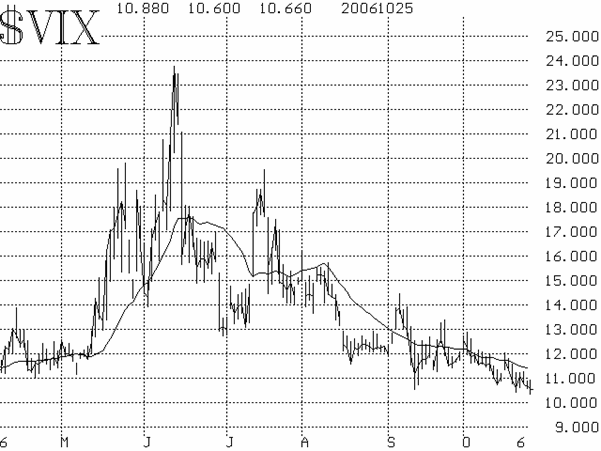
The volatility indices are very low. See the article on page 12 of The Option Strategist Newsletter for a more in-depth discussion of the meaning of this. Simplistically, $VIX is overbought. That doesn't mean the market can't continue to advance, but if $VIX climbs above 12, and especially if it climbs above 14, those would be negative developments.

In summary, one has to remain long this market, but should realize that prices don't rise unabated. A short-term correction is now a high-probability event, but the intermediate-term bullish case is intact.
Lawrence G. McMillan is the author of two best selling books on options, including Options as a Strategic Investment, recognized as essential resources for any serious option trader's library.