For the past several weeks (and now going on months) we've been following the potential recovery in the U.S. dollar. Many of the telltale signs started popping up at the end of last year, but we really didn't start getting confirmed clues until the last few weeks. But, after the major moves the U.S. dollar made in June, we can now see on the chart that the trend has shifted, and the dollar is pointed in a new direction. So, we'll show these charts one last time to illustrate what we see, and thus end the saga of the dollar.
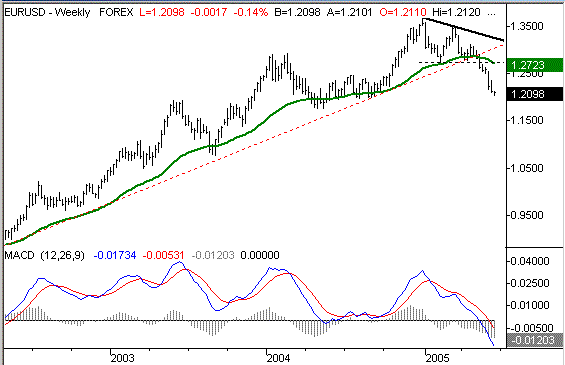
We'll stick with the two charts we've been using all year - The euro compared to the dollar, and then the dollar compared to the yen. We're pretty much seeing the same patterns on both of them. As a reminder, don't forget that the euro/dollar exchange rate chart may seem upside down - it's been moving higher as the dollar has weakened, and is now going lower as the dollar is recovering. That's just because the euro is being compared to the dollar (euro/dollar) instead of the other way around.
There were a handful of key support lines. The most important one was the long-term support line (red, dashed) that extended all the way back to 2002. The euro/dollar exchange fell under that line for the first time several weeks ago, and hasn't looked back since. We also wanted to see a lower low for this volatile chart, and we saw that too. February's low was 1.2730 (black, dashed), but this chart blew past that support line with this most recent tumble. The 200-day line (green) was loose support , but there's no doubt about that crossunder either. We're as far under the 200 day line as we have been in years, asd only seem to be widening the divergence. Take a look at the chart, then read on for our take on the dollar/yen chart.
Euro/Dollar exchange rate, with 200 day moving average - Weekly

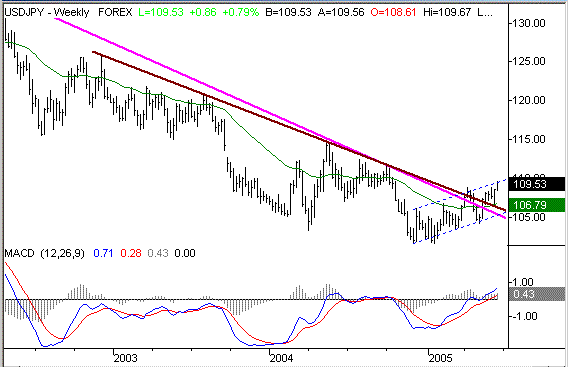
On our chart of the dollar/yen exchange rate, things look a little more normal - the chart fell when the dollar was weak, and the chart is rising now that the dollar is strengthening. The parameters are about the same as above. This chart had been meeting resistance since early 2002. Actually, there were two resistance lines (purple and pink). Both have been broken in the last month. We've also made a higher high and higher low since the beginning of the year. This uptrend is framed with blue dashed lines. This high-low trend isn't quite as decisive as the one you'll see on the euro chart, but there new trend lines are still meaningful. And finally, this exchange rate has crossed above the 200 day line (green), and is also accelerating away from it. Take a look.
Dollar/Yen exchange rate, with 200 day moving average - Weekly

So are we saying that these charts will make beelines back to their normal levels because the dollar has a one-way ticket back to where it was? Not at all. We expect the dollar's recovery to be just as choppy as its fall was. In fact, the recent recovery has set up a big reversal move that is likely to occur any day now. What we're saying is that there has been a major shift in the bigger trend, and it may not be wise to bet against the dollar anymore.
Price Headley is the founder and chief analyst of BigTrends.com.