NASDAQ Commentary
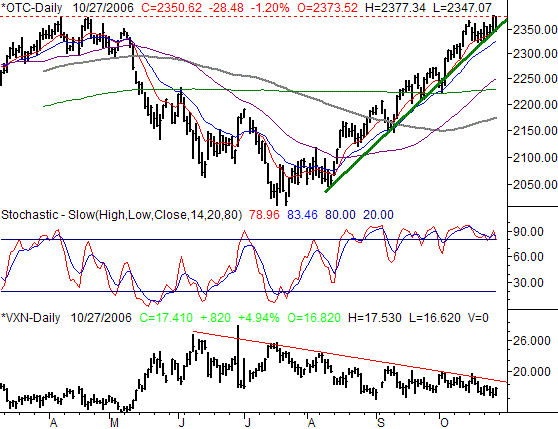
The NASDAQ's big 28.48 point loss on Friday left it at 2350.62...thanks to the 1.2% loss that day. For the week, despite the disastrous Friday, the index managed to close 8.32 points (+0.36%) above the previous week's close. However, there are a few things that say the weekly gain may be the last push for the bulls before a pullback.
One of the key lines we've been keeping an eye on was 2375, where the composite topped out twice in April. Knowing it could serve as resistance (i.e. a reversal point), some traders have been jittery as we approached that level. When did we hit it? On Thursday...we closed at 2379 that day. What happened? The next day - Friday - was the worst day we've suffered in a long time. While we can't absolutely say the whole thing was a baited setup to fool the folks 'buying at new highs', it is a little suspicious. Why the sudden change of heart? Good question.
On the flipside, the long-term support line (green) is incredibly still intact. It was at 2339 on Thursday, and at 2347 on Friday. Adjust it upward by about 8 points per day. It'll be at 2355 on Monday. Unless it actually breaks, we still can't say this is the beginning of the end. After that, the 20 day moving average line (thin, blue) currently at 2323 is the confirming make-or-break line.
In the meantime, we're on the verge of a stochastic sell signal where both lines fall under the 80 level.
As for the VXN, the resistance line at 18 (and falling) is still in place. Super-safe traders maybe using that line as the final indicator of a pullback.
If - and this is a big if - we do see a pullback materialize, the nearest support level is the 50 day line at 2250. However, we think the 200 day line at 2228 is a far more likely support area.
Contingency plan: a couple of closes above 2375 may extend this unlikely rally.
NASDAQ Chart

S&P 500 Commentary
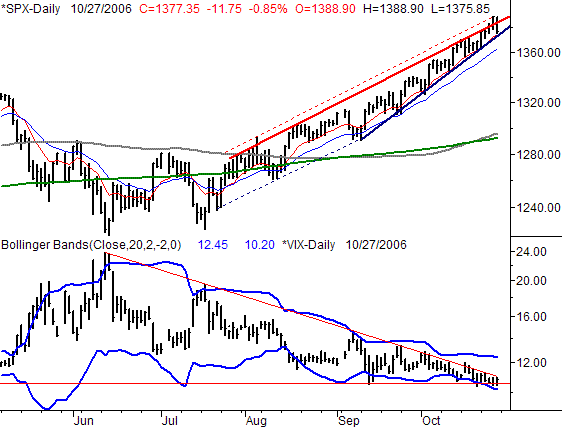
The S&P 500's close at 1377.35 on Friday was 11.75 points lower (-0.85%) than the previous day's close. However, for the week, the SPX closed 0.64% (+8.75 points) higher. The good news is - despite mixed arguments - the market's hand is going to be forced soon. We've been talking about a breakdown for a while, and we're now on the verge of possibly seeing one.
Not a lot to add here for the SPX. However, we can draw this analogy for the S&P 500....a trapeze act that's performing without a net - it's impressive, but potentially disastrous. The recent rally has been incredible, and maybe even a little unbelievable. As we discussed a week ago, it's very unusual for this index to be more than 6% away from the 200 day moving average line, currently at 1292. As of Friday, it's 6.5% higher than the 200 day line.
As the chart illustrates, the support line (blue) as well as the 10 day moving average line (this, red) have pushed the index even higher each time it even turned slightly weak. The move has almost been parabolic, which in turn means the tumble could be equally dramatic. The 'net' for this trapeze act is more than 6% lower...which really isn't much of a safety net - we'd call it the ground.
And how close are we to such a dismantling? There is no room for error on the support side of the chart. The 10 day line, as well as that support line, are both at 1374, versus the S&P 500's close at 1377 on Friday. The 20 day line might act as support; it's at 1363. Just beyond that, nothing.
Simultaneously, the resistance line for the VIX also has no room for error. The VIX is pushing up and into it; if it closes above it (11, as of Friday) it could be a clue of the same dip. Keep an eye on both.
S&P 500 Chart

Dow Jones Industrial Average Commentary
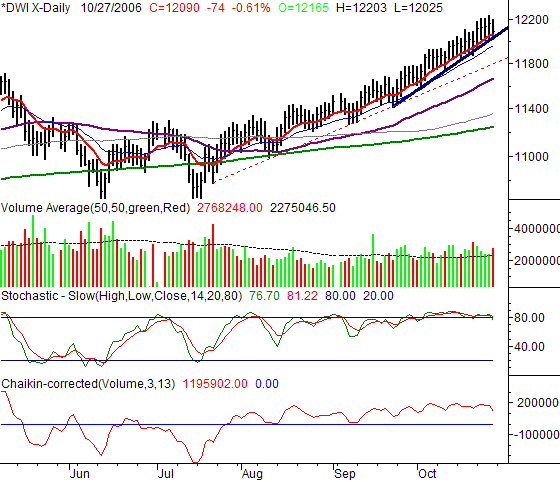
The Dow closed 74 points lower on Friday, ending the day at 12,090...0.61% lower. On a weekly basis, the blue-chip index still managed to close 88 points higher, or up by 0.73% higher. The story remains the same though; the index has climbed the wall of worry...inching higher the whole time it was poised to fall apart.
A different red flag for the Dow - volume. Although we've been trending higher for weeks, we're starting to see some high volume selloff (distribution) days...one of them coming on Friday. The prior one, seen on the 20th, was the highest volume day we've seen in weeks. While the bearish interpretation of accumulation or distribution is subjective, the Chaikin line is not - it's objective (the Chaikin line is just a volume weighted momentum line). It had been inching higher through the whole rally, but may have changed direction as of Friday when it made a lower low...for the first time in weeks. The actual sell signal here would be a Chaikin line cross under zero, which really may not be that far off.
A stochastic sell signal may not be too far off either.
BUT, as with all the indices right now, the support lines are hanging tough. The Dow has them everywhere between 12,025 and 11,815. Each consecutively lower one is a little weaker than the one right above it.
Dow Jones Industrial Average Chart

Price Headley is the founder and chief analyst of BigTrends.com.