Today we're going to take a break from our normal stock-trading fare and look at some charts it seems more and more of you are becoming interested in. Of course, even if you're just a casual buy-and-holder, there's still some good stuff for you. After all, gold, oil, and the dollar still affect the short-term market. And yes, we'll explain how.
First up, crude oil. We've actually got two oil charts to consider...a weekly, and a daily.
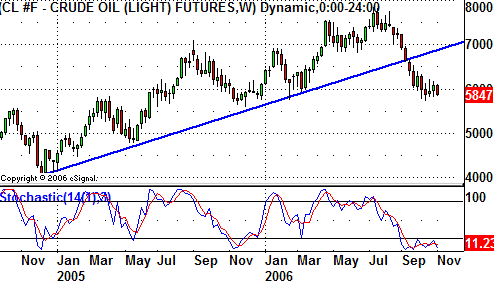
The weekly chart is inserted to illustrate one key point - that the previous uptrend for oil is fully broken. That's NOT to say we won't see oil get very high again. But, the key support line (blue) that was driving the uptrend is no longer applicable. A word to the wise about that....buying the dip is not as prudent as it was in 2004 and 2005 (and part of 2006). Crude oil closed at 58.50 yesterday, while that support line is at 68.40. Don't treat oil - or oil stocks - like you did a year ago.
In the meantime, you can also see that crude oil futures have been stochastically oversold for a while. Implication #1? There's a growing pressure to send them higher again. However, the market has been content to just live with the pressure thus far. Implication #2? If the market is content to just let oil stay oversold, and sink while it is, then the potential is certainly there for oil to keep on sinking.
Crude Oil - Weekly

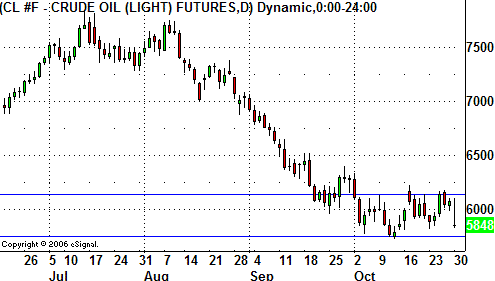
How do you which one of those two routes is going to be taken? Enter the daily chart. We've seen the futures move sideways since October 4th, which has established a key support and a key resistance line. What we're looking for is a break of one or the other. It's really quite simple...a couple of closes above resistance at 61.90 is bullish, while a break under 57.75 is bearish. Both, however, are short-term views. Remember, the long-term chart has already been damaged pretty badly.
Crude Oil - Daily

As for the relationship with the market, there's a conditional inverse correlation. If the crude futures drift mildly in either direction, there won't be much pressure on stocks. If instead we see a strong, decisive move for oil futures, look for stocks to be pressured the other direction.
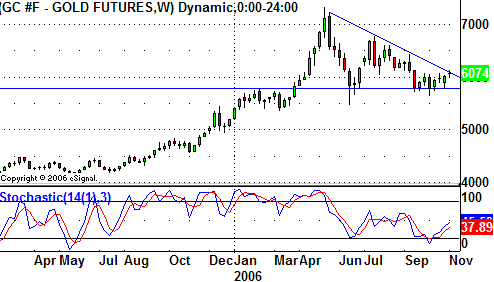
Gold back above 600? Yep, it's true. And with only a little more of an upside move, the recent small gain could jump-start a much bigger one. The resistance line (blue) that's been guiding gold lower since the peak in May is being pressured after yesterday's big bounce. Gold futures reached 613.20...right where the line is. But first.....
The chart shows a wedge formation. The lower edge is a horizontal boundary at 577.50. Yes, we saw intra-week trades under that level a couple of times, but the 577.50 level - on a closing basis - has been much more meaningful. Simultaneously, that resistance line has been falling. Of course, the wedge is very close to closing up, which will result in one side or the other of that wedge giving way. Based on yesterday's move, the upper line is on the verge of cracking. Keep an eye on the 613 mark.
The gold rebound is admittedly an interesting one. It's traditionally a hedge against inflation. But, at least in the opinion of the Fed - as based on the recent decision to not raise rates - is that inflation isn't a problem. The problem is, gold has a predictive value to it...the increase in gold prices says that speculators are still looking for inflation to be persistent. Interestingly, Fed funds futures are anticipating a drop in rates during 2007. A disparity? Oh yeah, but one we'll cover at a later time. For now, the rise in gold doesn't bode well for stocks, as traders look for short-term defense against falling stocks. (continued below)
Gold Futures - Weekly

Finally, the U.S. dollar. The sawbuck probably has the least effect on the stock market of all three charts we're looking at today...at least in the short run. In the long run, it can and does affect the domestic market.
Rather than look at a specific exchange rate, let's just look at the U.S. Dollar Index....it's an aggregate of the dollar against all other currencies.
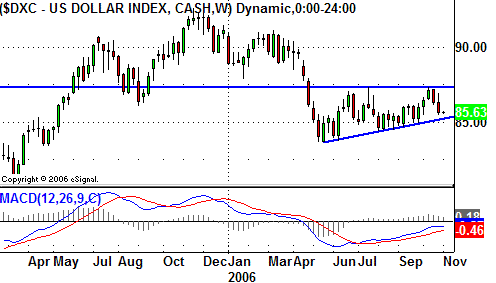
On the weekly chart, we can see a wedge-like shape, albeit a very shallow one...almost two horizontal lines. The resistance is at 87.30, while support is at 85.20 and rising. As of right now, the momentum is to the downside. At the same time, with yesterday's close at 85.62, we're just a hair above a retest of that support level. Keep an eye on both lines, even though the support line poses the biggest threat of breaking right now. (continued below)
U.S. Dollar Index - Weekly

What's the connection with stocks? It's a long-term one. A weak dollar means domestic spending is greater on domestic goods, since they're relatively cheaper than foreign goods. For that matter, foreign purchases of domestic goods and services are also stronger, since foreign dollars go a lot farther in the U.S. than they would in their respective countries.
Isn't that a win-win for American companies? Yeah, but....the price to be paid comes in the form of weak foreign demand for domestic investments, and dollar-denominated bonds specifically. While the effect on corporate America is not felt immediately, in the long run, it's an impediment. As far as short-term trading goes though, the key thing to worry about right now are those support and resistance lines.
Price Headley is the founder and chief analyst of BigTrends.com.