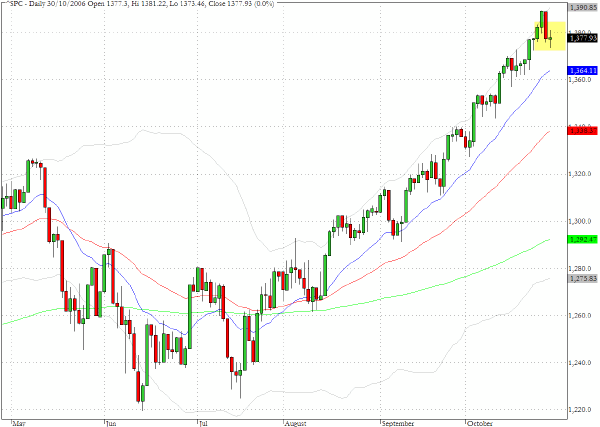
The S&P 500 cash index (^SPC) finished Monday's session more or less where it began it and in so doing a Doji candlestick was formed. The 20-day EMA has acted as support throughout the sustained bullish move since July and it will be important in anticipating the intermediate direction of the index to monitor the technical performance on the next occasion that this level is tested.
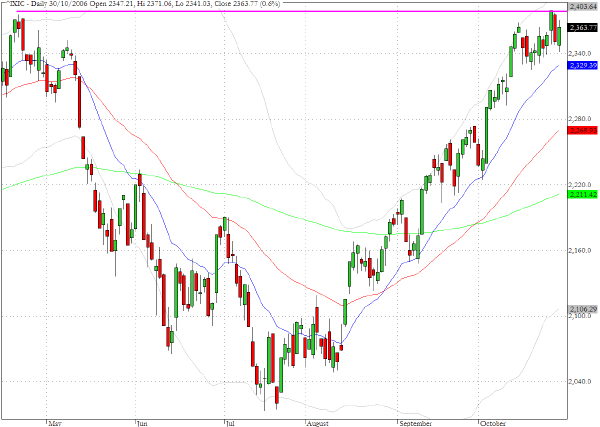
The Nasdaq Composite (^IXIC) recovered some of its poise following Friday's selling and regained 0.6% to close at 2363. We have remarked before on the steepness of the right hand side of the valley formation and the fact that since the middle of August the index has not closed once below the steeply ascending blue line on the chart which represents the 20-day exponential moving average.
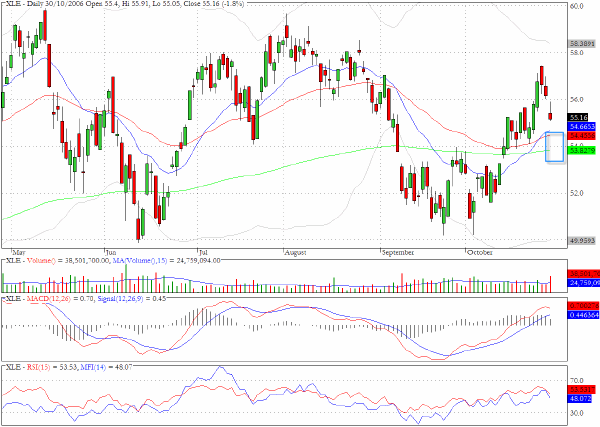
The energy sector fund, XLE, ran into resistance in the vicinity of the $58 level echoing a similar pattern that can be fund on the oil index (^XOI) chart at the 1160 level. As XLE retreats back towards the intersection of all three moving averages that we track we would expect to see another attempt to restore a more positive tone to the sector.
TRADE OPPORTUNITIES/SETUPS FOR TUESDAY OCTOBER 31, 2006
The patterns identified below should be considered as indicative of eventual price direction in forthcoming trading sessions. None of these setups should be seen as specifically opportune for the current trading session.
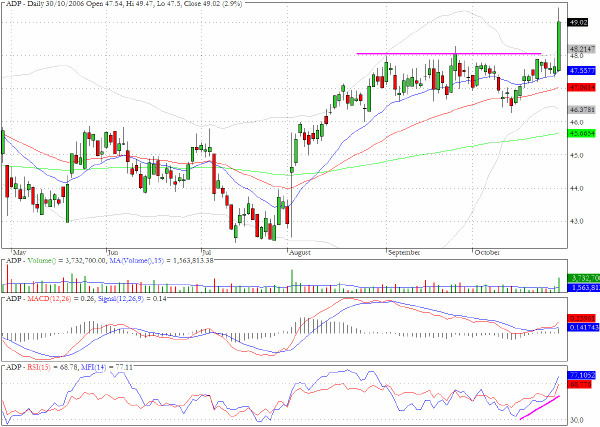
Automatic Data Processing (ADP) broke through range bound resistance yesterday on twice the average daily volume. Earnings will be announced today before the market opens but clearly the expectation is that they will exceed expectations - it will be worth monitoring the stock to see whether yesterday's anticipatory enthusiasm was justified.
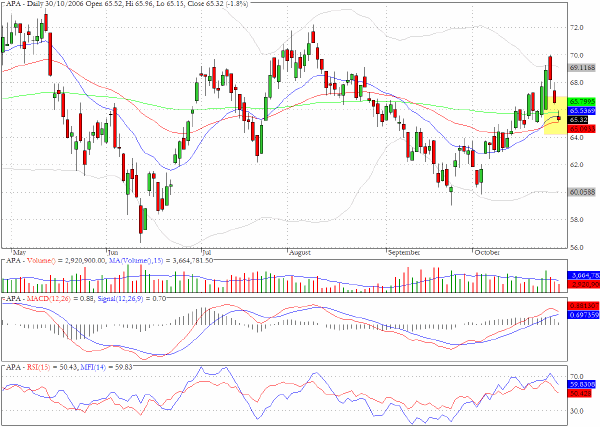
In line with our comments on XLE and the oil index the chart for Apache (APA) illustrates how many emery sector stocks are positioned at the juxtaposition of three key moving averages.
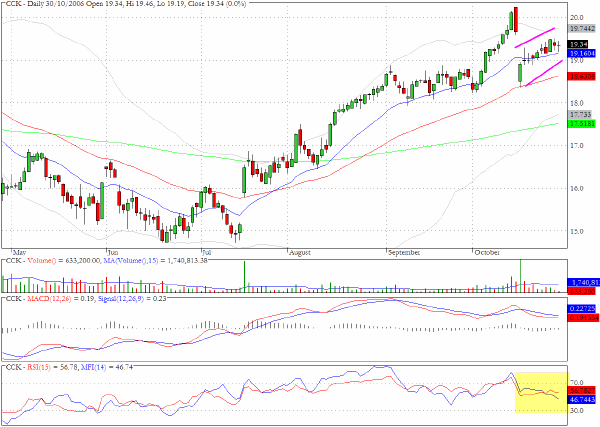
Crown Holdings (CCK) has developed an ascending channel formation following the gap down on October 17.
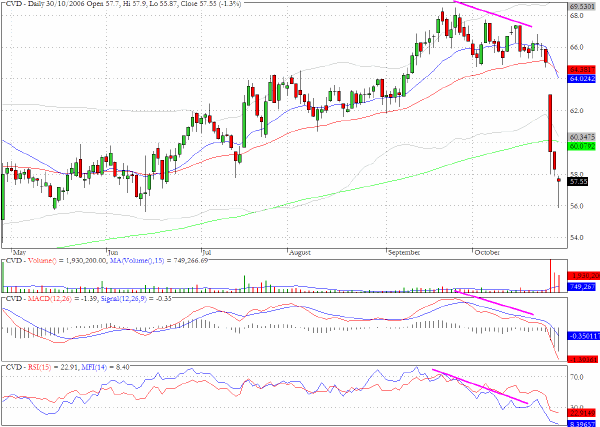
The chart for Covance (CVD) is instructive as it clearly demonstrates the negative divergences that presaged the recent collapse in the stock.
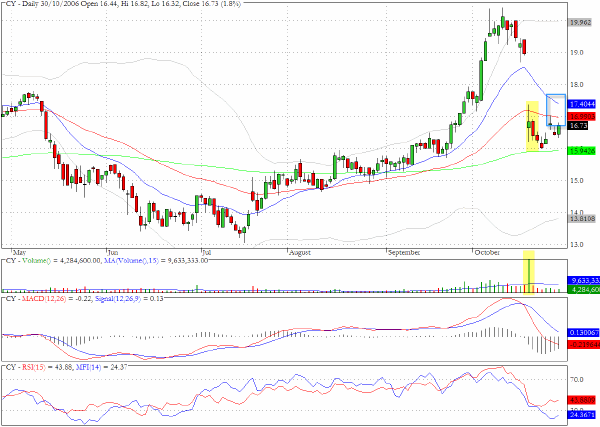
Cypress Semiconductor (CY) is entering a critical area where further selling may emerge.
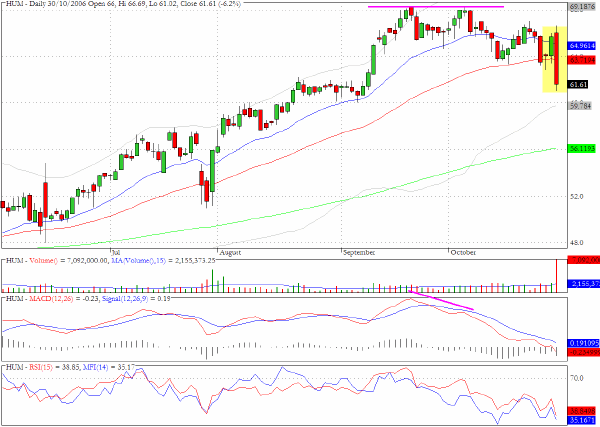
The chart for Humana (HUM) is also a good example of negative momentum and money flow divergences and yesterday's six percent decline on heavy volume puts the 200-day EMA in play.
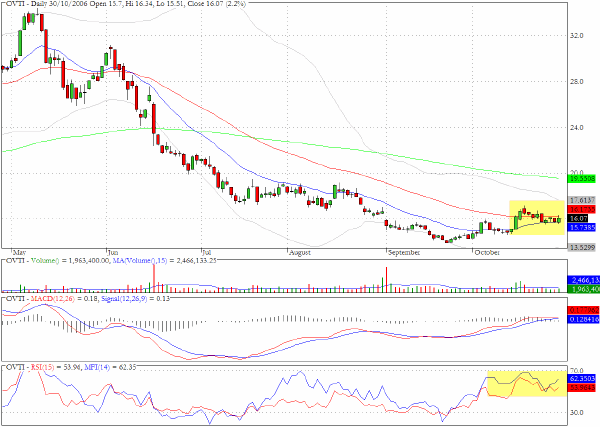
Omnivision (OVTI) is in a constricted range and the accumulation in the stock suggests that some are anticipating higher prices.
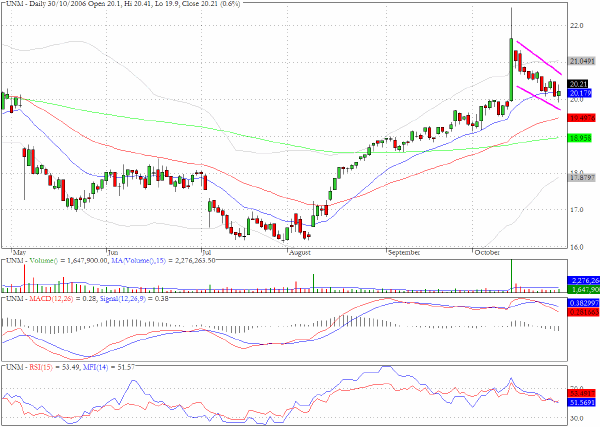
Unum Provident (UNM) has a rather well define bullish flag formation.
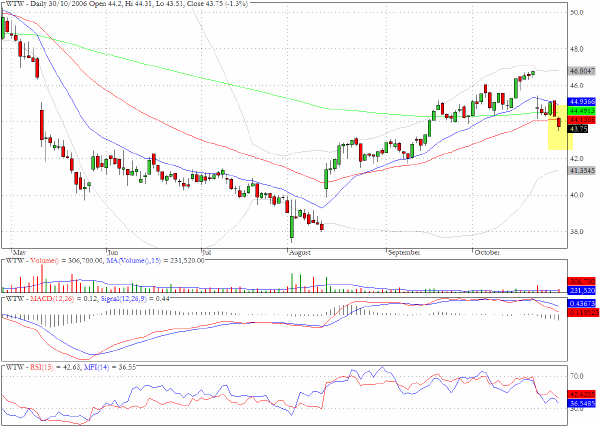
We would suggest that Weight Watchers (WTW) has reached a critical juncture as it slipped below both the 50- and 200-day EMS's in yesterday's trading. The volume pattern is not, however, too helpful in confirming whether the recent price action is indicative of a more serious correction ahead.
Clive Corcoran is the publisher of TradeWithForm.com, which provides daily analysis and commentary on the US stock market. He specializes in market neutral investing and and is currently working on a book about the benefits of trading with long/short strategies, which is scheduled for publication later this year.
Disclaimer
The purpose of this article is to offer you the chance to review the trading methodology, risk reduction strategies and portfolio construction techniques described at tradewithform.com. There is no guarantee that the trading strategies advocated will be profitable. Moreover, there is a risk that following these strategies will lead to loss of capital. Past results are no guarante of future results. Trading stocks and CFD's can yield large rewards, but also has large potential risks. Trading with leverage can be especially risky. You should be fully aware of the risks of trading in the capital markets. You are strongly advised not to trade with capital.