Equities were under pressure yesterday on the release of further economic data that was weaker than that envisaged in the soft landing scenario. Several broad indices closed very near to their 20 day moving averages, and in the case of the small cap Russell 2000 index notably below it.
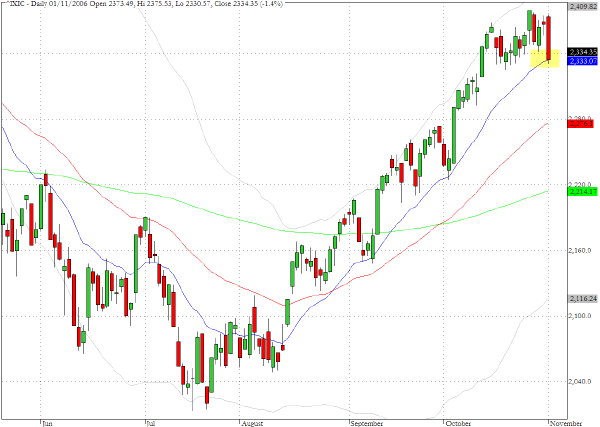
The S&P 500 retreated to 1367 (just above its 20-day EMA at 1366) and the Nasdaq Composite (^IXIC) experienced a greater proportional decline of 1.4% but ended the session almost exactly at the juncture with its 20-day EMA.
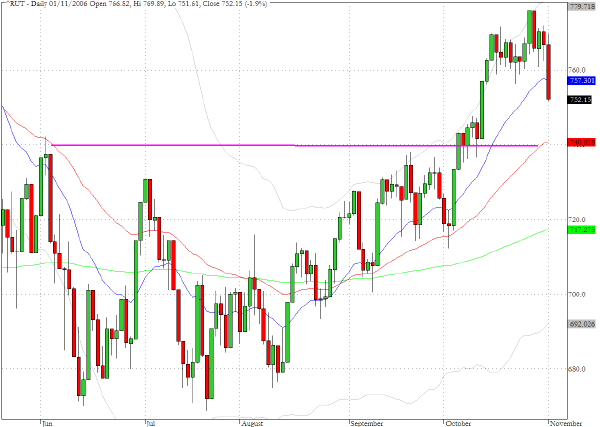
The small cap index - the Russell 2000 (^RUT) - dropped almost two percent and closed visibly below the 20-day EMA. The pivotal 740 level which represented a hurdle that confined trading following the slump in May until the early October resurgence is now back in play as this also coincides with the 50-day EMA.
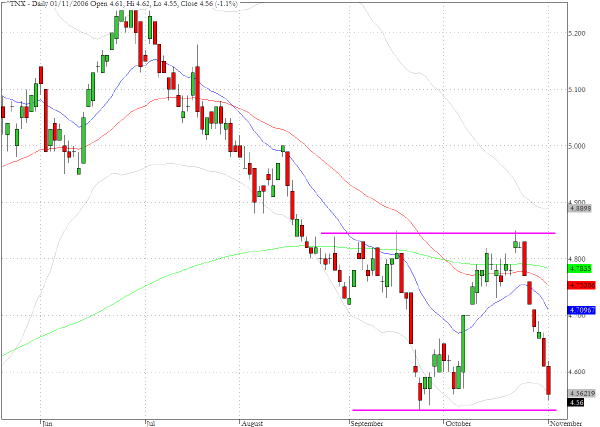
Treasury yields continued their steep decline and as we discussed in yesterday√Ę‚,¨‚"Ęs commentary the current yield at 4.56% marks the lower boundary of the recent range. Tomorrow√Ę‚,¨‚"Ęs employment data may provide additional evidence that could undermine the soft landing scenario and a decisive break below 4.5% would raise the specter of long rates being as much as 100 basis points below three month rates.
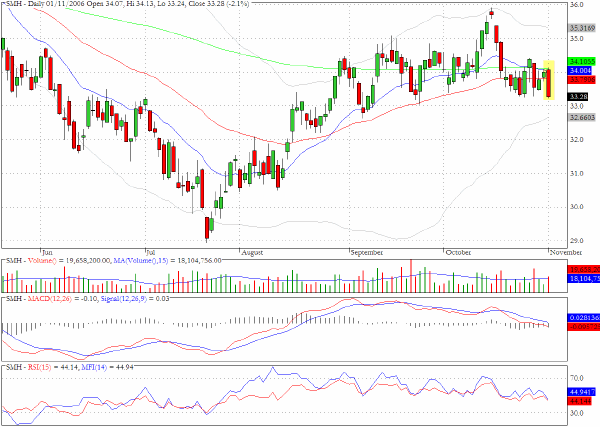
Several semiconductor stocks were amongst those that performed relatively poorly in yesterday's sell-off and the sector fund, SMH, closed below all three moving averages.
TRADE OPPORTUNITIES/SETUPS FOR THURSDAY NOVEMBER 2, 2006
The patterns identified below should be considered as indicative of eventual price direction in forthcoming trading sessions. None of these setups should be seen as specifically opportune for the current trading session.
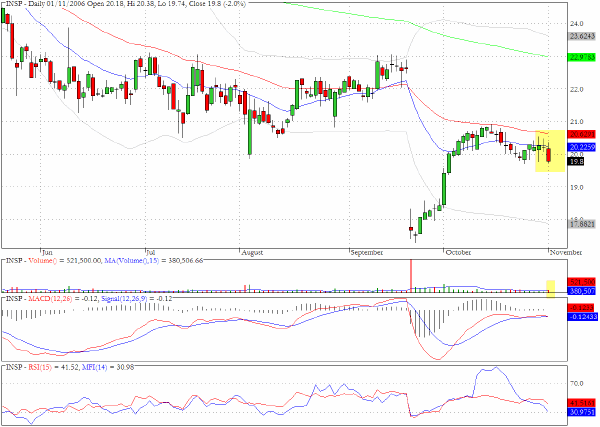
Infospace (INSP) could be vulnerable to further selling in a less favorable equity environment.
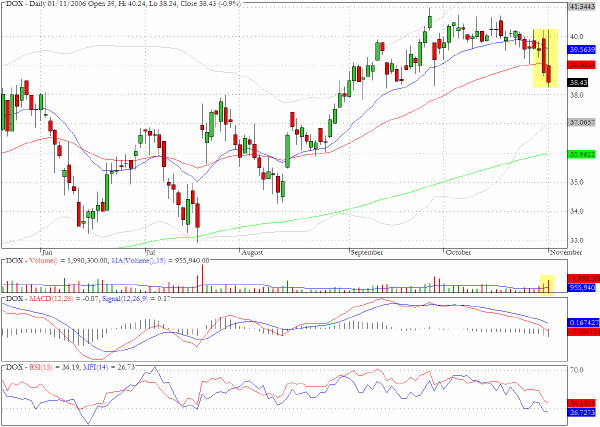
Amdocs (DOX) was experiencing distribution during October and the last two sessions are seeing a pick up in volume as the stock dropped below a potential support area coinciding with both of its shorter moving averages.
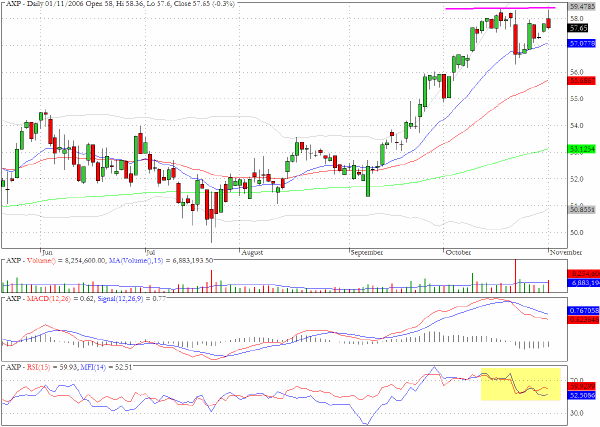
American Express (AXP) has some negative divergences and an ascending channel formation that could give way to further selling.
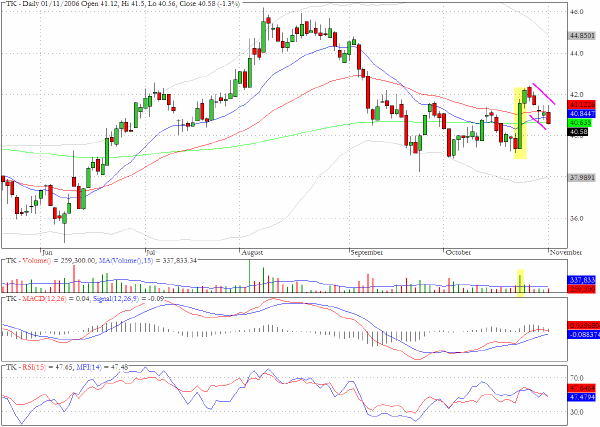
One of the few constructive charts on the long side following yesterday's action is for Teekay Shipping (TK) which is displaying the appropriate technical characteristics of a bull flag pattern.
Clive Corcoran is the publisher of TradeWithForm.com, which provides daily analysis and commentary on the US stock market. He specializes in market neutral investing and and is currently working on a book about the benefits of trading with long/short strategies, which is scheduled for publication later this year.
Disclaimer
The purpose of this article is to offer you the chance to review the trading methodology, risk reduction strategies and portfolio construction techniques described at tradewithform.com. There is no guarantee that the trading strategies advocated will be profitable. Moreover, there is a risk that following these strategies will lead to loss of capital. Past results are no guarante of future results. Trading stocks and CFD's can yield large rewards, but also has large potential risks. Trading with leverage can be especially risky. You should be fully aware of the risks of trading in the capital markets. You are strongly advised not to trade with capital.