NASDAQ Commentary
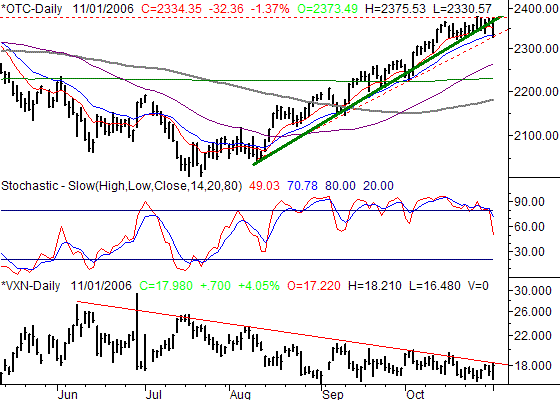
Well, we were due for a bashing, and got it Wednesday. The NASDAQ Composite closed 1.37% lower, closing at 2334.35, or 32.36 points lower. It was the worst single day loss since September. For the week, the NASDAQ is down 16.27 points, or 0.69%. And, Wednesday's tumble left this index on the verge of a much bigger, pro-longed slide.
We mentioned 2375 - the highs hit for the year back in April - had the potential to be resistance again...especially when we saw the uptrend started to falter as it was being re-approached. On Wednesday, the idea was validated. After five consecutive sessions of threatening that level, the failure to cross it finally inspired the bulls to throw in the towel. The result was the lowest close since October 11th, and some serious technical damage. Namely, a close under a key support line (green) as well as the 10-day line (red).
In fact, the trip back down to the 20-day average also left the composite resting right on a key long-term support line (red, dashed) at 2330, which was also Wednesday's low. If that line breaks, we think it could trigger the correction we've been expecting for a while.
On the flipside, crossing above resistance at 2375 would still be a bullish event.
We're not going to go into any more detail on the NASDAQ, as we've expanded our analysis this week for the other two charts we follow.
NASDAQ Chart

S&P 500 Commentary
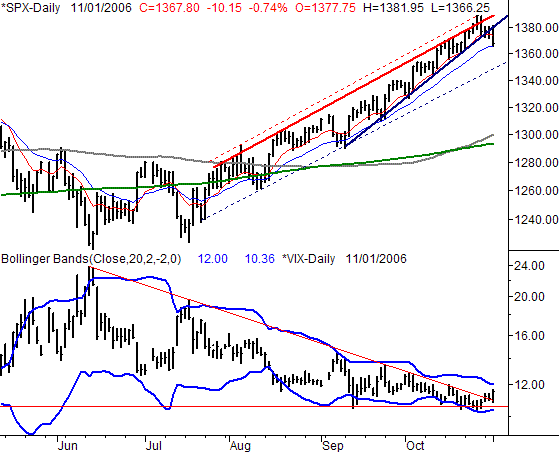
The S&P 500's close at 1367.8 on Wednesday was 10.15 points lower (-0.74%) than Tuesday's. That close is 9.55 points (-0.69%) below last Friday's close, and like the NASDAQ, leaves the index on the verge of a big pullback. There's just one more support line to break.
As we discussed a couple of weeks ago, the slope of the SPX's rise became even more steep in September; see the transition from support at the thin, blue, dashed support line to the broad, dark blue solid line. We could equate it to lighting the other end of the candle, and you know what happens when you burn a candle at both ends. Well, the more aggressive dark blue support line finally gave way this week.
But, and incredibly, there's still some hope left for the bulls. Even with the giant dip, the 20-day average line at 1366 is still intact, as is the long-term support line at 1350. That said, the 20-day line's failure to act as support will be a much bigger issue for the market.
As for where any breakdown may finally land, the next floor is way below - the 200-day line at 1293 (and maybe the 100-day line at 1300).
As you may guess though, the fact that the VIX is finally starting to work up and off those ridiculous lows suggests the most-bearish-case scenario could materialize. The resistance line that had been guiding the VIX lower since July was finally breached when the VIX crawled back up to 11.51. This in itself does not bode well for stocks. However, for a full-blown confirmation of the bearish VIX pattern, wait and see what happens when the upper Bollinger band at 12.0 us challenged. If the VIX finds resistance there like it did in July and September, the index could salvage itself. If instead it can't turn the band line into a resistance line, and starts pressing it higher instead (like we saw in May), the correction is even more likely.
S&P 500 Chart

Dow Jones Industrial Average Commentary
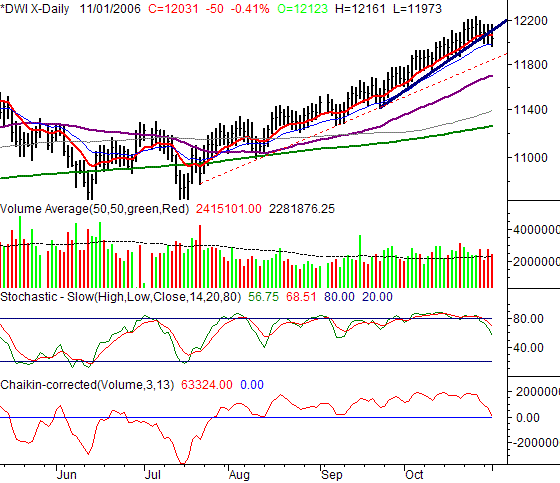
The Dow Jones Industrial Average lost 0.41% on Wednesday, closing 50 points lower to end the session at 12,031. The Dow is 59 points under (-0.49%) last week's close, and is facing the same likely breakdown our other two indices are facing.
This is the first time we've seen four consecutive losing days for the Dow since August. As a result, a significant short-term support line (dark blue) has given way; the 20 day moving average line (light blue) has stepped in as support, however. That 20 day average, currently at 11,983, is the next line in the sand. If we get a couple of closes under that line - as we think we will - then a move even lower is much more likely.
For the Dow though, there are also several potential support lines spaced out evenly between here and the 200 day line (green, at 11,261). The first checkpoint is the long-term support line (red, dashed), currently at 11,873, and rising. Although there are other potential bounce levels like the 50 day line (purple) and the 100 day line (gray), that dashed support line is the critical one to watch.
In the meantime, we already have one complete sell signal...in the stochastic indicator. And, we're about a day away from a Chaikin line sell signal. The Chaikin line - a volume weighted momentum line, will say officially say 'sell' when it falls back under zero. And, barring a miracle on Thursday, there's nothing that can be done now to prevent it.
At this point, resistance is now at 12,059 and 12,160, although we don't expect them to be a factor in the near future.
Dow Jones Industrial Average Chart

Price Headley is the founder and chief analyst of BigTrends.com.