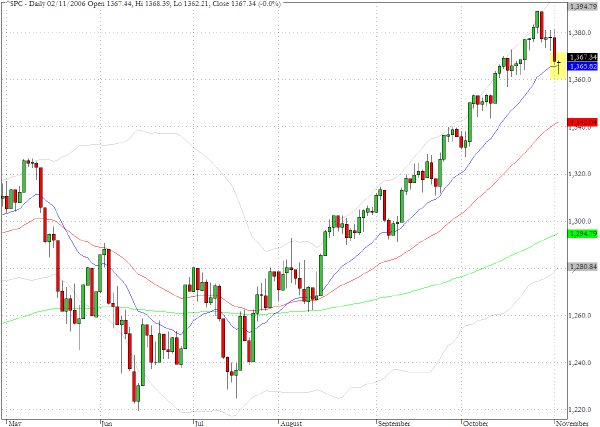
The indices moved within fairly narrow ranges yesterday and the S&P 500 index produced a Doji candlestick that straddles the 20-day EMA. Today's employment data will be closely monitored for further clues as to the longer term prospects for economic activity and there is the possibility that either a robust report or a very weak report could propel equities into range expansion in either direction. Keeping an eye on the reaction from the Treasury market would be advisable, although we expect to be on the sidelines for much of the session.
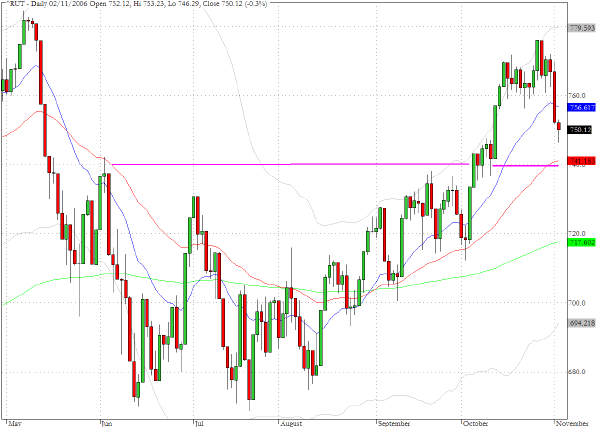
The small cap index - the Russell 2000 (^RUT) - remained the under-performer in yesterday's action. Following Wednesday's almost two percent decline the index retreated by another 0.3%.
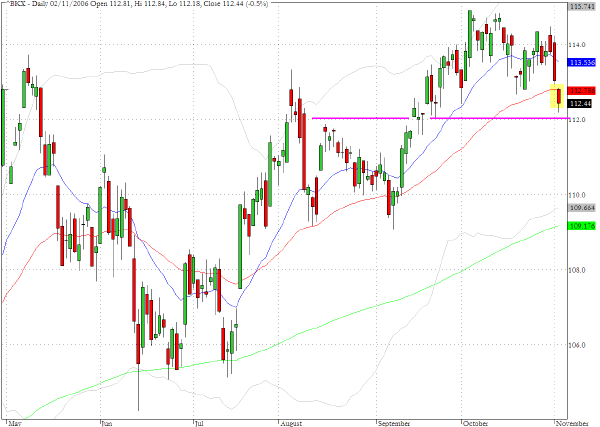
The bank index (^BKX) closed yesterday below the 20-day EMA but is also approaching an area of potential chart support.
TRADE OPPORTUNITIES/SETUPS FOR FRIDAY NOVEMBER 3, 2006
The patterns identified below should be considered as indicative of eventual price direction in forthcoming trading sessions. None of these setups should be seen as specifically opportune for the current trading session.
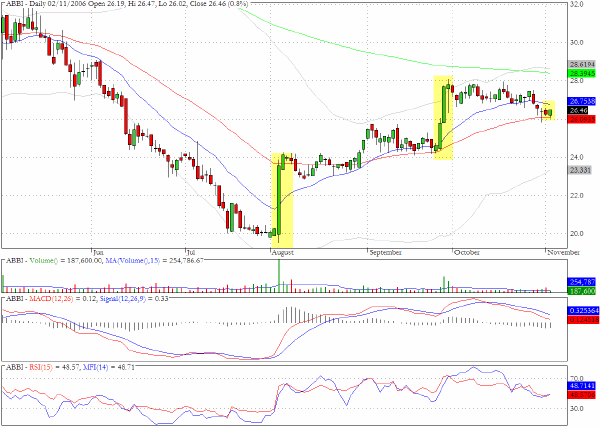
Abraxis Biosciences (ABBI) came to rest yesterday at the 20-day EMA and may be preparing for another step upwards.
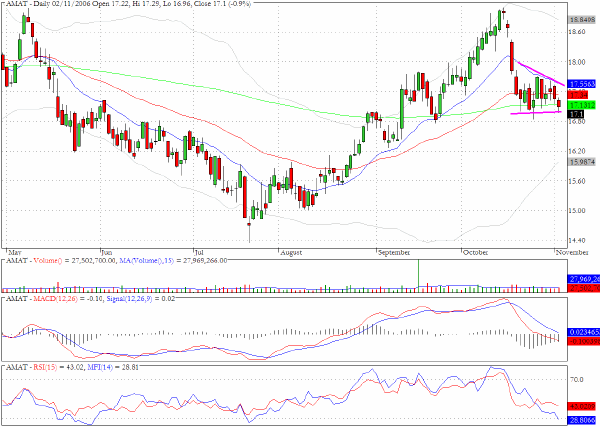
After registering a double top in mid October Applied Materials (AMAT) is now in a descending wedge pattern just above the 200-day EMA.
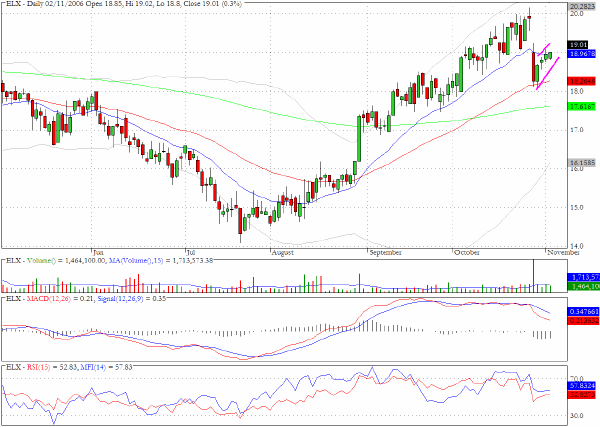
Emulex (ELX) has a mini bear flag formation.
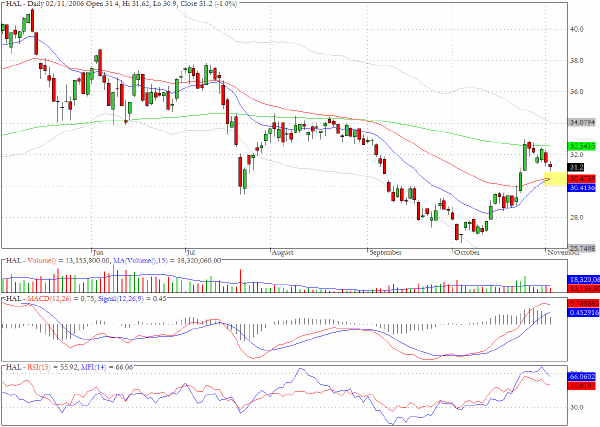
Haliburton (HAL) could find that the intersection of two moving averages just below yesterday's close provides a platform for renewed upward progress.
Clive Corcoran is the publisher of TradeWithForm.com, which provides daily analysis and commentary on the US stock market. He specializes in market neutral investing and and is currently working on a book about the benefits of trading with long/short strategies, which is scheduled for publication later this year.
Disclaimer
The purpose of this article is to offer you the chance to review the trading methodology, risk reduction strategies and portfolio construction techniques described at tradewithform.com. There is no guarantee that the trading strategies advocated will be profitable. Moreover, there is a risk that following these strategies will lead to loss of capital. Past results are no guarante of future results. Trading stocks and CFD's can yield large rewards, but also has large potential risks. Trading with leverage can be especially risky. You should be fully aware of the risks of trading in the capital markets. You are strongly advised not to trade with capital.