The equity market began yesterday's session with a continuation of Monday's rally but most of the indices reached a plateau in late morning trading which defined the upper boundary to price activity. Late in the session, there was a realization that there was no appetite by index traders to take out the recent highs and this lead to some unwinding of bullish positions and the market retreated into the close.
The Shooting star formation was much in evidence on index and individual stock charts yesterday and the S&P 500 chart provides a good illustration of the pattern.

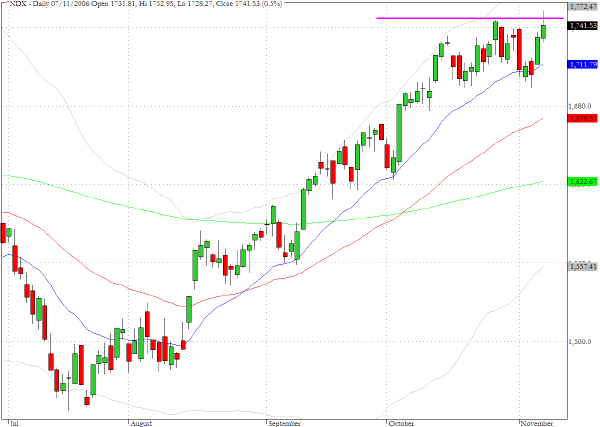
The Nasdaq 100 index (^NDX) probed above the October 26 high but was unable to close above that session's close.
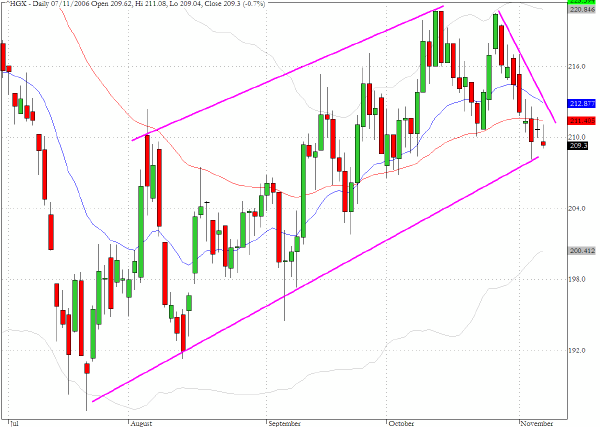
The housing index (^HGX) has traded within a well defined recovery channel since the July lows. There is a possibility that a double top to the recovery was formed in October and this underlines the significance of the fact that the index now appears to be on the verge of violating the lower boundary of the channel.
TRADE OPPORTUNITIES/SETUPS FOR WEDNESDAY NOVEMBER 8, 2006
The patterns identified below should be considered as indicative of eventual price direction in forthcoming trading sessions. None of these setups should be seen as specifically opportune for the current trading session.
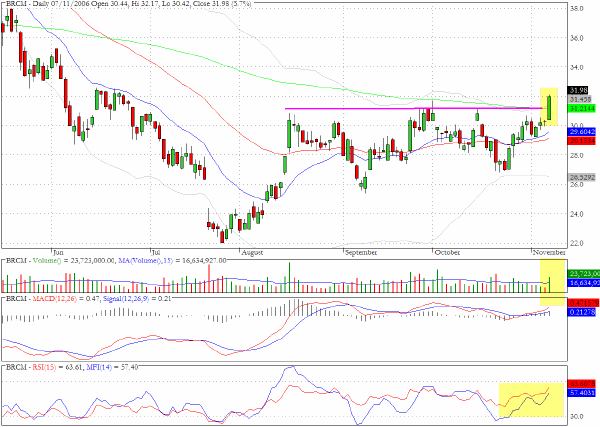
Broadcom (BRCM) pushed above the 200-day EMA and the upper recent price range yesterday on above average volume.
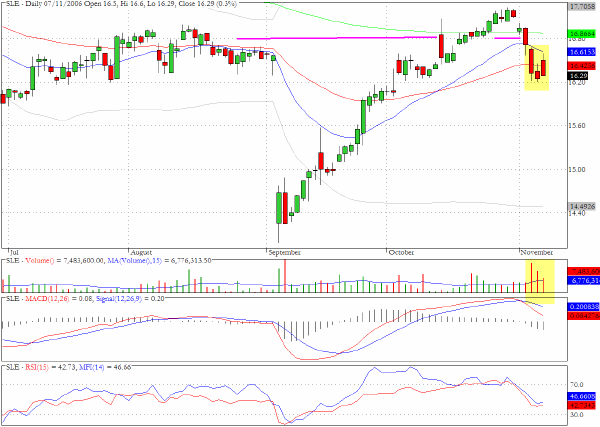
We have been monitoring Sara Lee (SLE) for some time as the rupture pattern and major gap down in early September is often a precursor to more critical price behavior. The pick up in volume and inability to remain above the 50-day EMA suggests that there may be further weakness ahead.
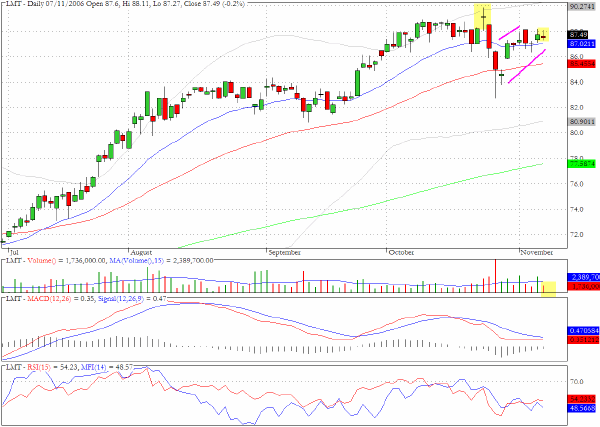
Lockheed Martin (LMT) produced a tiny Doji formation yesterday on very light volume in what appears to be a bearish ascending channel pattern.
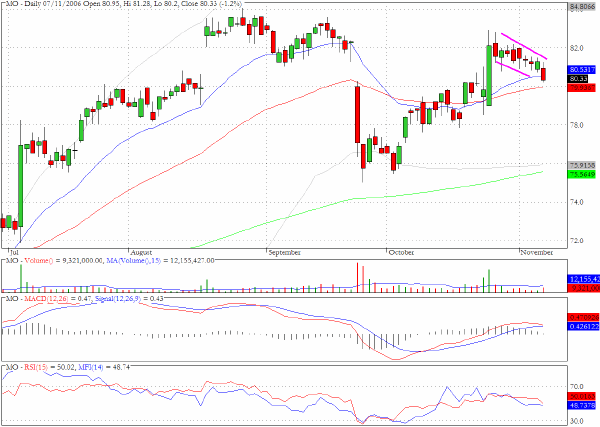
Since the long green candlestick that appeared on the Altria (MO) chart on October 25 the price has retraced back to the 50-day EMA and there may be some renewed buying interest.
Clive Corcoran is the publisher of TradeWithForm.com, which provides daily analysis and commentary on the US stock market. He specializes in market neutral investing and and is currently working on a book about the benefits of trading with long/short strategies, which is scheduled for publication later this year.
Disclaimer
The purpose of this article is to offer you the chance to review the trading methodology, risk reduction strategies and portfolio construction techniques described at tradewithform.com. There is no guarantee that the trading strategies advocated will be profitable. Moreover, there is a risk that following these strategies will lead to loss of capital. Past results are no guarante of future results. Trading stocks and CFD's can yield large rewards, but also has large potential risks. Trading with leverage can be especially risky. You should be fully aware of the risks of trading in the capital markets. You are strongly advised not to trade with capital.