NASDAQ COMMENTARY
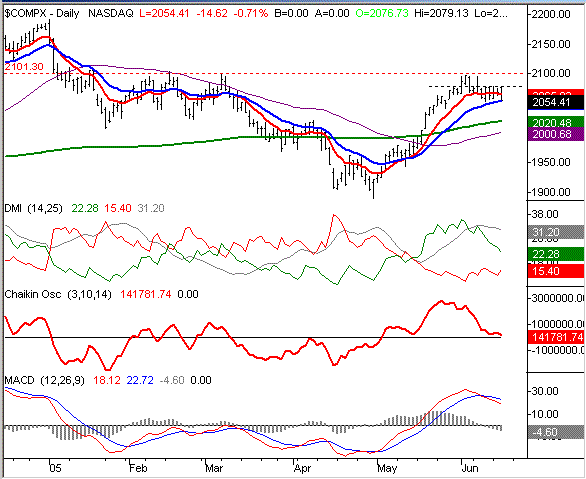
With the NASDAQ just five points under Friday's close, we'd be hard pressed to say that this week had been eventful so far. As is was towards the end of last week, the composite is just stuck an a very tight range, between 2053 and 2079. That stagnation can be partially blamed on this Friday's option expiration, which generally has a capturing effect on the market a few days beforehand. The other culprit, though, is the general trading public now forced to decide whether or not stocks can continue at the red-hot pace we saw last month. Now that the NASDAQ has had two mild losing weeks in a row following four weeks of huge gains, the buyers aren't nearly as bold....especially when we're currently on track to make a third consecutive losing week. As we pointed out last weekend, there are a few more bearish patterns than bullish ones right now, so we're in the bearish camp.
Let's look at the range first. The bottom edge of this range has just been solidified by the 20 day moving average line (blue), which just caught up with the market. Last week's and this week's lows have traced this line pretty well, but haven't traded under it. So, it looks like there's a support effort at this average. Note, however, that there is a major push to break that support line today - it might be worth looking at again when the market closes, to see if we've fallen under 2054. On the top side, the composite has made a couple attempts at getting above 2080 (black, dashed) over the last two weeks, but each failed attempt was met with a pretty significant pullback.
As we mentioned above, all the other signs suggest that the support will indeed be broken. We're now into our fifth day of a MACD sell signal, and the Chaikin line as well as the DMI lines are both on the verge of making a sell signal. The official Chaikin signal will be a cross under zero, telling us that the volume trend has turned from bullish to bearish. The official DMI sell signal will be a cross of the DMI lines (red over green), illustrating that the high-low trend has tipped in favor of the sellers.
But, neither of those signals is complete, nor have we made a close under the 20 day line. At this point, we'd like to see all three of those signals made before being any more bearish. Fortunately, all three are probably going to occur simultaneously when and if it does occur. So, there shouldn't be much (if any) delay. Until then, it's something of a waiting game. Be prepared to wait until after Friday's expiration.
NASDAQ CHART - DAILY

S&P 500 COMMENTARY
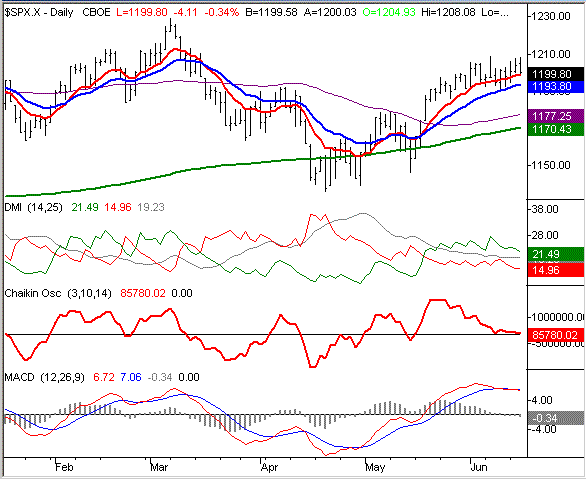
We're using the exact same tools for the S&P 500 today that we used for the NASDAQ above. We're doing this to really let us compare apples to apples. While the S&P looks like it's setting up a few sell signals of its own, this same index isn't nearly as vulnerable as the NASDAQ is. And that's largely the result of the NASDAQ's rampage in May - the bigger they are, the harder they fall.
Where the NASDAQ has already fallen under its 10 day line, the S&P's 10 day moving average (red) appears to be its support level. So even with today's dip, the technical trend here is still fully bullish. purely based on upward momentum. Plus, where the NASDAQ has fallen back after hitting a peak two weeks ago, the SPX has managed to keep logging higher highs (albeit very incrementally). That's why the DMI line here looks a little different than the NASDAQ's DMI chart. You can also see that the bearish MACD cross for this chart really hasn't widened. That's just a sign that the negative momentum really hasn't grown since the signal was given. But the ultimate proof is in results - the S&P was actually up a fraction last week. Gains are bullish, no matter how small they might be. So, you can see that the S&P 500 isn't in the same trouble as the NASDAQ is, and may survive any market-wide dip quite well.
However, that's not to say that it will not suffer at all. The SPX is pressuring the 10 day average today, and it's clear that the momentum has slowed up a great deal. In fact, the volume trend for the S&P 500 has actually reversed and turned bearish exactly like the NASDAQ's. For that reason, we have to expect this index to lose at least some ground. Why so much emphasis on volume? Of the three technical indicators we've plotted today, it's the only leading indicator. The MACD and DMI tools show current and past data, but we know that the volume trend tends to shift before the market does. Seeing the Chaikin line pointed lower and on the verge of a cross under zero is evidence that there are more sellers than buyers, even if the index inched higher last week.
The question is just how much might the S&P lose. There's no clear answer, but we wouldn't expect a substantial pullback based on what we see on the chart. The 20 day line should provide support at the 1194 mark. And if things really deteriorate, a bounce at the 50 day line (1177) is likely. But even that would only be a 22 point drop. That might be a decent move for short-term trading, but not a cause for alarm regarding long-term holdings.
In any case, we've yet to get any technical sell signals here, except for the debatabel MACD crossunder. So, patience is required here too. Again, this stall might last through Friday.
S&P 500 CHART

Price Headley is the founder and chief analyst of BigTrends.com.