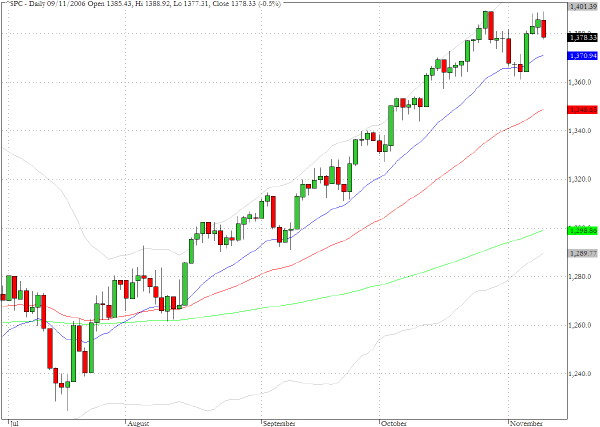
Volume picked up in equity trading yesterday and most indices turned in negative performances. The Russell 2000 (^RUT) was the weakest performer among the broad indices and pulled back by one percent. In comparison the retreat for the S&P 500 was more subdued with a 0.4% decline. We will be watching the broker dealer sector today as the index (^XBD) registered a more serious fall of 2.2%.
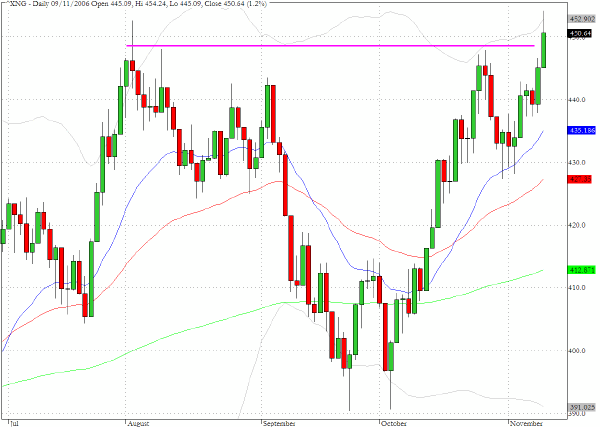
The Amex natural gas index (^XNG) broke to a new high yesterday.
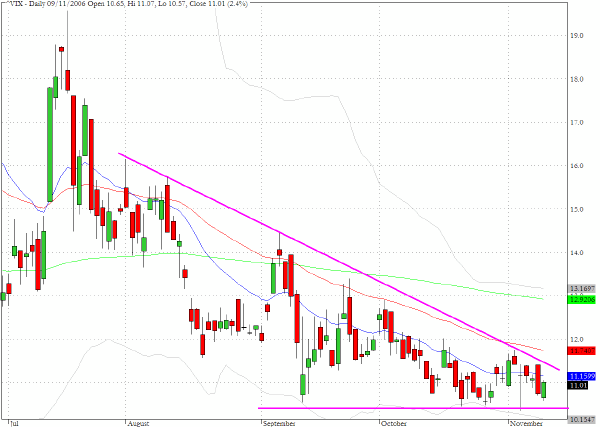
Since the precipitous and broad based selling in May the CBOE Volatility index (^VIX) has steadily declined and, as the chart pattern reveals, the descending wedge formation that has developed appears to be running out of room to extend much further. It is hard to imagine that there could be significantly lower volatility values ahead and the credit and derivative markets have been extraordinarily blessed in the last few months by historically low risk premiums.
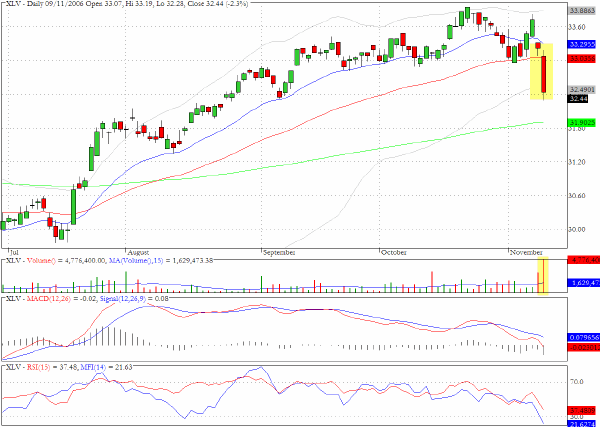
Another casualty in yesterday's trading was the health care sector and the ETF for the sector, XLV, reflects the weakness that was found in several related stocks. United Health Group (UNH) plummeted by more than five percent, Abbot (ABT) declined by 3% and Johnson and Johnson (JNJ) also fell 2.7%
TRADE OPPORTUNITIES/SETUPS FOR FRIDAY NOVEMBER 10, 2006
The patterns identified below should be considered as indicative of eventual price direction in forthcoming trading sessions. None of these setups should be seen as specifically opportune for the current trading session.
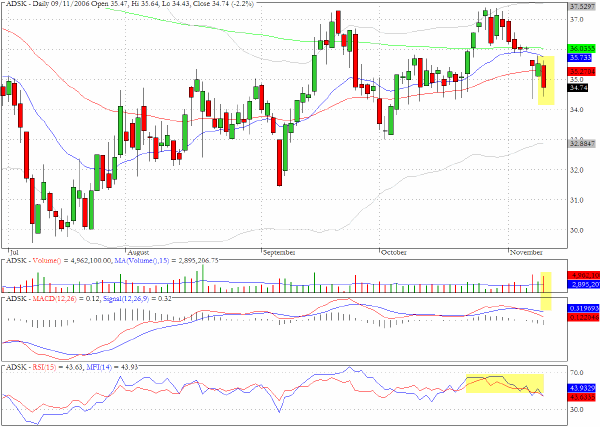
Autodesk (ADSK) moved down below all three moving averages yesterday on above average volume and there is scope for a short sale opportunity as the stock might well be headed back towards the bottom of the trading range
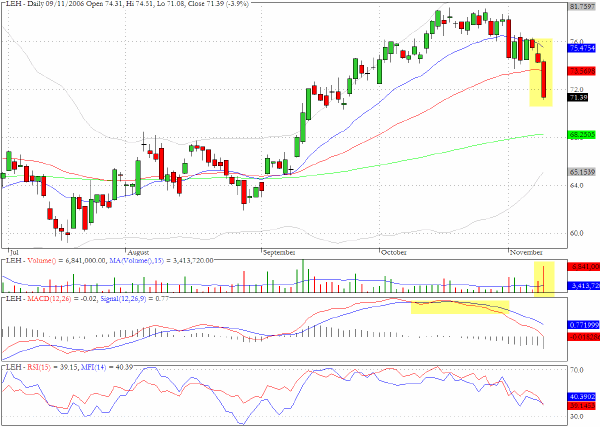
The investment banks were notably weak in yesterday's session and the chart for Lehman Brothers (LEH) captures the negative divergences that had been building in momentum and money flow better than most.
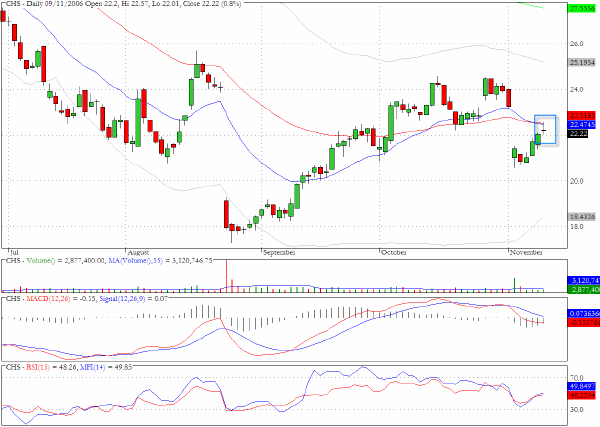
Chico's (CHS) recorded a Doji at the junction of two moving averages in the context of a bearish recovery/pullback pattern.
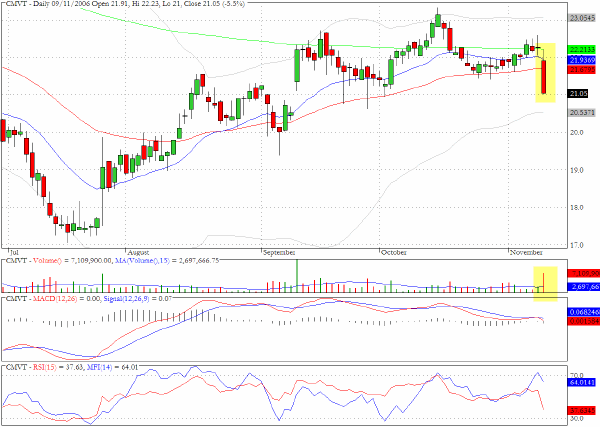
Comverse Technology dropped more than five percent on heavy volume and closed below all three moving averages.
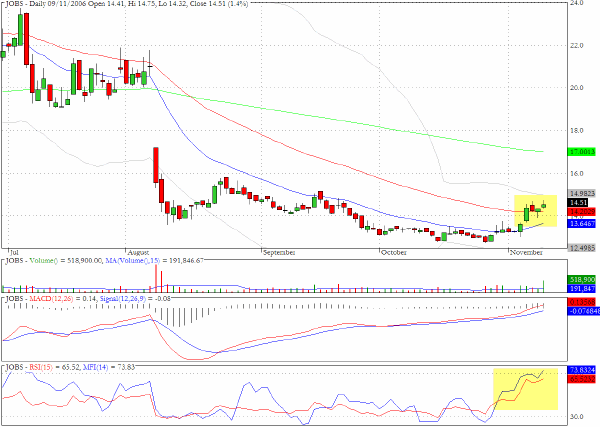
Despite the negative environment yesterday 51job (JOBS) managed to gain 1.4% on more than twice the average daily volume. The MFI chart shows an abnormally steep upward slant and a range breakout seems imminent.
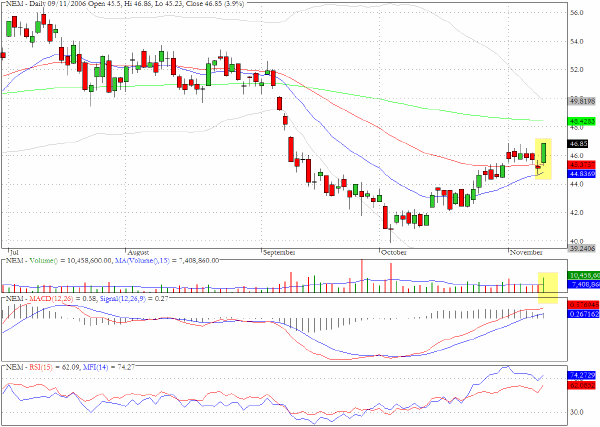
Newmont Mining (NEM) could be headed back towards $52 but will need to confront the 200 day EMA hurdle first.
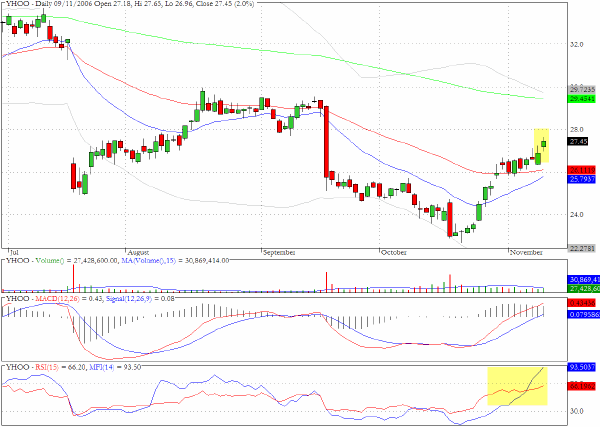
Somewhat similar to the JOBS chart, the MFI values for Yahoo (YHOO) have reached an extreme and the relatively strong performance from yesterday encourages us to put the stock on our Watch List today.
Clive Corcoran is the publisher of TradeWithForm.com, which provides daily analysis and commentary on the US stock market. He specializes in market neutral investing and and is currently working on a book about the benefits of trading with long/short strategies, which is scheduled for publication later this year.
Disclaimer
The purpose of this article is to offer you the chance to review the trading methodology, risk reduction strategies and portfolio construction techniques described at tradewithform.com. There is no guarantee that the trading strategies advocated will be profitable. Moreover, there is a risk that following these strategies will lead to loss of capital. Past results are no guarante of future results. Trading stocks and CFD's can yield large rewards, but also has large potential risks. Trading with leverage can be especially risky. You should be fully aware of the risks of trading in the capital markets. You are strongly advised not to trade with capital.