For the first time since early August, the market recently attempted a downside correction. It was a feeble short-lived attempt, and the net result was that the bulls once again showed that they remain in control.
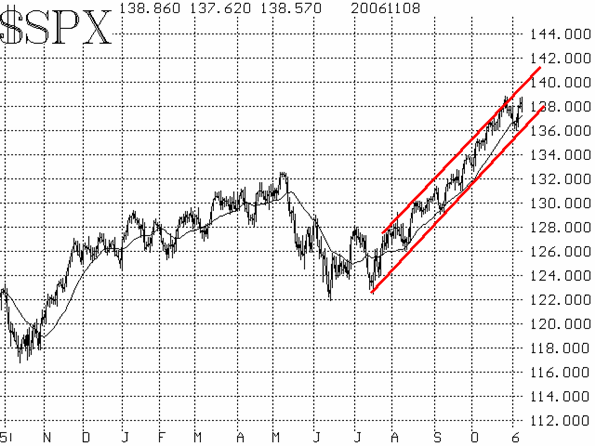
$SPX found support from a couple of sources at the bottom of that correction: from the technical support level at 1360 as well as from the bottom of the trading channel that it has been in since July (Figure 1). During the correction, the 20-day moving average was penetrated, but that was apparently irrelevant -- something to keep in mind during future correction attempts.

The correction began just after $SPX had risen so far that it probed out of the upper end of the channel. Fortunately for the bulls, the support at the bottom of the channel held. If $SPX ever declines below the bottom of the channel, some frenzied selling will probably take place. So, it seems to be that if $SPX trades out of the channel -- either on the upside or the downside -- the market can be sold. Otherwise, the intermediate-term bullish pattern dominates.
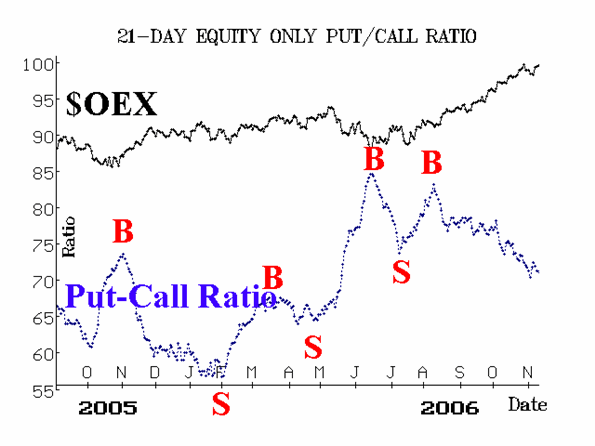
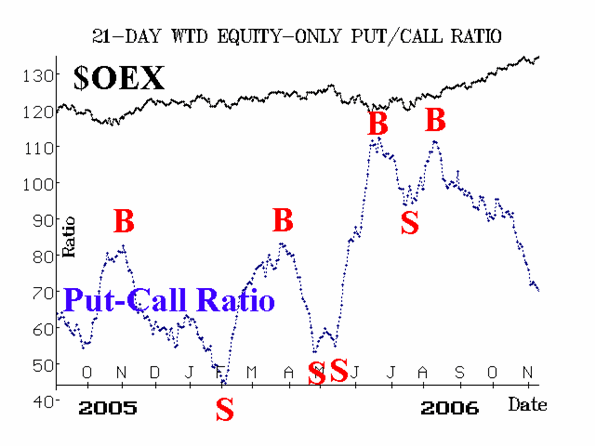
The steadiest indicator throughout the bull run since last summer has been the equity-only put-call ratio. Both the weighted and standard ratios continue to make new lows, which means they are on buy signals (see Figures 2 and 3). Moreover, they are not that low on their charts, so they could have a good deal more room to run. This would fit in well with the feature article's contention that this bull move is not yet over. Finally, the QQQQ weighted remains on a buy signal, as it has since August, but has reached the lower regions of the chart and is thus getting overbought.


Market breadth was the only indicator that gave an actual sell signal during the recent correction. However, at major turning points, breadth is more of a confirming indicator rather than a leading one, so we did not give those sell signals a lot of credence. During the correction, breadth never got oversold enough to generate true buy signals.
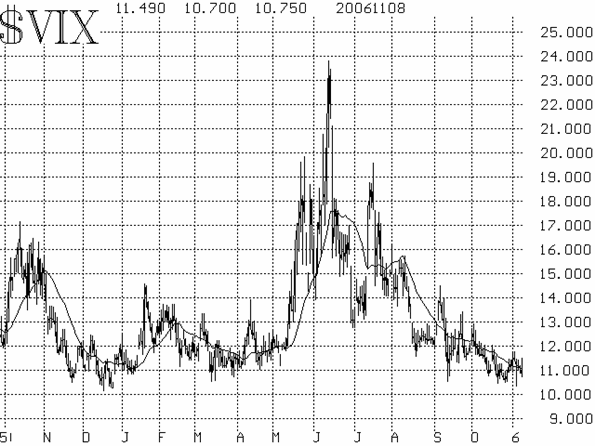
Finally, the volatility indices ($VIX and $VXO) remain at extremely low levels. $VIX held at 11 or slightly above until the election and then fell to the 10.60 level. These indicators are extremely overbought. However, as we have pointed out, the market can continue to advance as long as $VIX remains low. We would become worried if $VIX (as well as actual volatility) began to rise. Until then, they are not a hindrance to higher prices.

In summary, this sounds like a broken record, but we continue to remain intermediate-term bullish, while acknowledging that short-term overbought conditions might create sharp, but short-lived corrections.
Lawrence G. McMillan is the author of two best selling books on options, including Options as a Strategic Investment, recognized as essential resources for any serious option trader's library.