NASDAQ Commentary
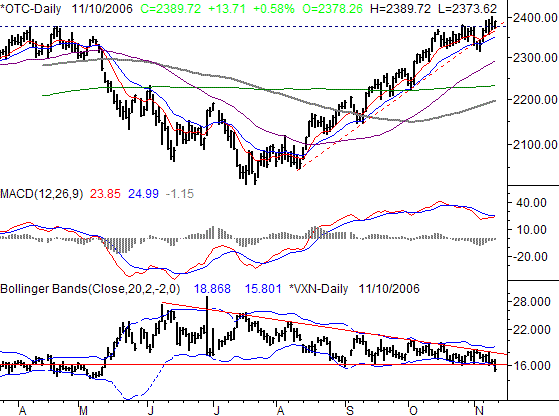
The NASDAQ's 13.71 point gain on Friday was a 0.58% rally, parking the index at 2378.26 for the week. The composite closed 58.93 points above the prior week's close, gaining 2.53% over the last five sessions. Along the way, the NASDAQ got - and stayed - above this year's previous high of 2375, which could provide a little inspiration for the bulls in the coming week. On the flip side, the VXN plunged on Friday pretty deeply. That's the major pitfall for the bulls.
That long-term support line (red, dashed) that was finally broken last week? The same one that was a red flag for the long-awaited correction? Yeah, forget it - at least for the time being. The NASDAQ climbed back above it on Monday, and ended up finding support there (again) later in the week. As result, the composite also found new highs last week. That's bullish, but as we've been saying, the support line is still the key to the uptrend. It's currently at 2376, and rising sharply. Unless the line breaks, the trend remains technically bullish.
However, we saw a curious development with the CBOE NASDAQ Volatility Index (VXN). It saw a giant plunge on Friday, falling from 16.66 to 15.52. That's not necessarily the biggest single-day dip we've seen from the VXN, but it's now as far under the lower Bollinger band as it's been in months. It's very bullish as long as it stays there, but an eventual/inevitable rebound is now in the works. Of course, that's potentially bearish. Plus, the VXN's dip also pulled it under a long-term support line....the same interpretation applies though.
Technically bullish? Yes. Extremely vulnerable to bearishness? Yes. But as always, the trend is your friend until there's a clear reason for it not to be. Keep reading though.
NASDAQ Chart

S&P 500 Commentary
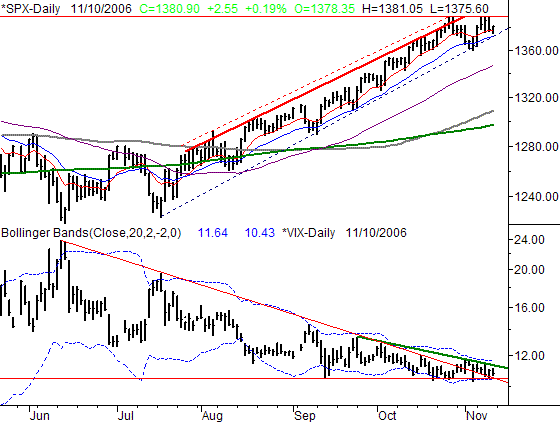
The S&P 500's close at 1380.90 on Friday was the result of a 2.55% (+0.19%) gain. On a weekly basis, the large-cap index gained 16.60 points for the week, or 1.22%. However, despite three attempts, the SPX still couldn't get a trade above highs at 1389, where it topped out two weeks ago. We see the S&P 500 still trapped between a rock and a hard place, or between converging support and resistance lines.
In general, our take on the NASDAQ's chart applies here as well. But, we have a key advantage with the S&P's chart we may as well utilize - the horizontal resistance that's been established at 1389. While the support line is still rising (blue, dashed), and while the 10 and 20 day moving average lines (red and blue, respectively), we still have to look at things bullishly. But, there's a ceiling at 1389; from this point, only a move above there would justify adding any bullish/long positions. In other words, despite the bullish chart, there's not enough reward (9 points between Friday's close and that resistance) to justify the risk of buying in now. If the trend is still intact, it will be good for a lot more than 9 points.
And what is the risk? The same as before...an over-extended market, and an unbelievably low VIX. The VIX broke past a key resistance line a couple of weeks ago, but a shorter-term one (green) has been established since then. It's at 11.35 as of now; a close above that one would go far in getting any bearish trend going again.
On a side note, it's worth noting the S&P 500, nor the VIX, have actually made any meaningful progress over the last two weeks. So, while things may 'appear' bullish here, they actually aren't. Is that an omen that the slow-down (and reversal) is already here, and has thus far been obscured? We expect to know within a few days.
S&P 500 Chart

Dow Jones Industrial Average Commentary
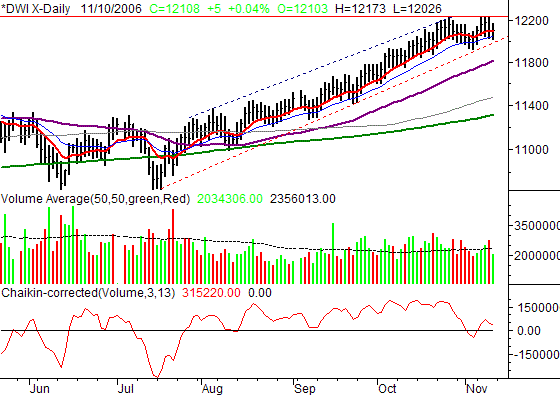
The Dow Jones Industrial Average closed basically flat on Friday. The weekly gain of 122 points was 1.02% above the prior week's close, leaving the blue chip index at 12,108. Like the S&P 500, the Dow took three shots last week at getting above the year's high of 12,236 hit two weeks ago. But, the best it did was a touch on 12,240 on Tuesday. Like the SPX, the Dow looks stuck between a rock and a hard place.
The scenario here is the same as the SPX's horizontal resistance and rising support. The ceiling is at 12,236; only a close above that line would really merit any new bullish positions, even though the rising support (red, dashed) says the bullish trend is still intact.
At this point last week, we had a Chaikin line sell signal, as it fell under zero, telling us the volume trend had turned bearish. This week, the volume was nothing was bullish except Thursday. However, Thursday's bearish volume was also the highest volume day of the week. A glimpse of how traders viewed the early bullishness? Maybe they were just glad to get an exit opportunity for bullish trades they should have gotten out of a week earlier.
We saw a slight rebound on Friday when the lower support line was re-tested, but volume was tepid. Despite the gain, the Chaikin line is pointed lower again, on the way to another crossunder.
The wedge is getting tighter, and should squeeze the index out of it soon. The support line will be at 12,025 on Monday. The trend says it's going to be bullish, while the over-extended index is overdue for a correction.
Dow Jones Industrial Average Chart

Price Headley is the founder and chief analyst of BigTrends.com.