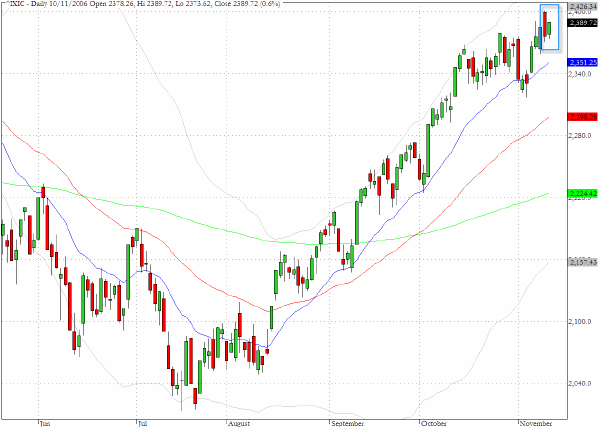
Volume tailed off in equity trading last Friday with both SPY and QQQQ registering approximately two-thirds of their average daily volume. Inside day formations were also recorded on the daily chart for the Nasdaq Composite index (^IXIC) and the Russell 2000 (^RUT) index.
The period leading up to Thanksgiving is often favorable for equities and on balance the evidence from many of the individual charts that we scanned over the weekend suggests that this pattern looks like repeating itself again.
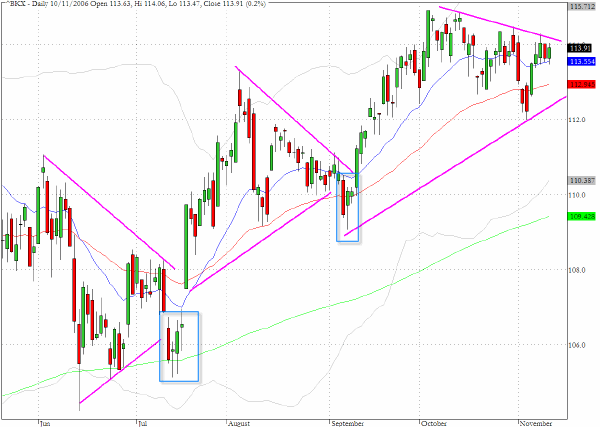
The banking index (^BKX) has formed a succession of triangular patterns on the chart displayed and once again the price development is approaching a point where it is being confined by the declining upper trendline as it moves further into the apex. On both of the previous occasions when this happened the index produced false breakdowns at the time when the apex was breached (see the blue boxes on the chart below) but then immediately resumed the upward bias in both cases.
In the current circumstances there has not been the same steepness to the trendlines of the triangle and there is also much less evidence of the long range expansion candles that formed part of the previous triangles. Our intuition is that the formation could be pointing to a more extended sideways pattern than before.
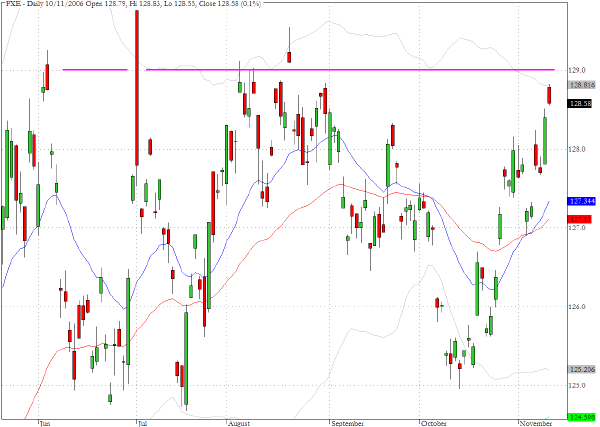
The Euro is approaching the top of the range equivalent to 1.29 in the inter-bank market as is evident on the chart for the exchange traded sector fund FXE that tracks the currency.
TRADE OPPORTUNITIES/SETUPS FOR MONDAY NOVEMBER 13, 2006
The patterns identified below should be considered as indicative of eventual price direction in forthcoming trading sessions. None of these setups should be seen as specifically opportune for the current trading session.
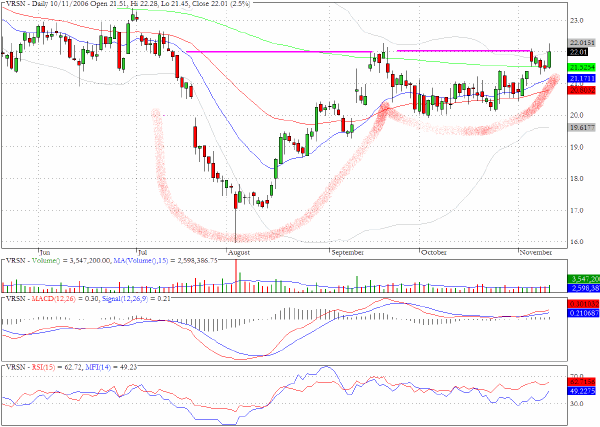
We have outlined what appears to be a good cup and handle formation for Verisign (VRSN)
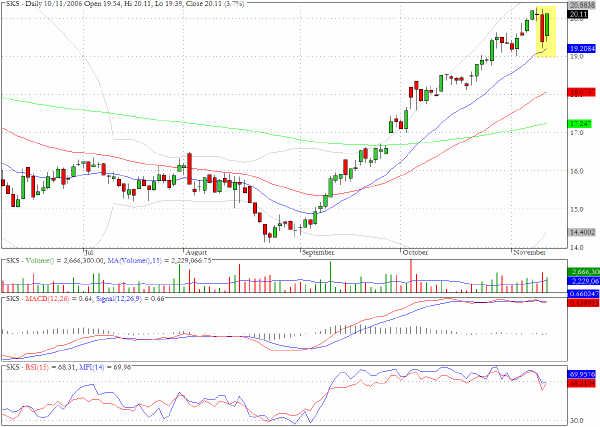
Saks (SKS) produced a reversal pattern on Friday following Thursday's long red candle which was accompanied by heavy volume. The range expansion sessions could be pointing to an imminent change in direction.
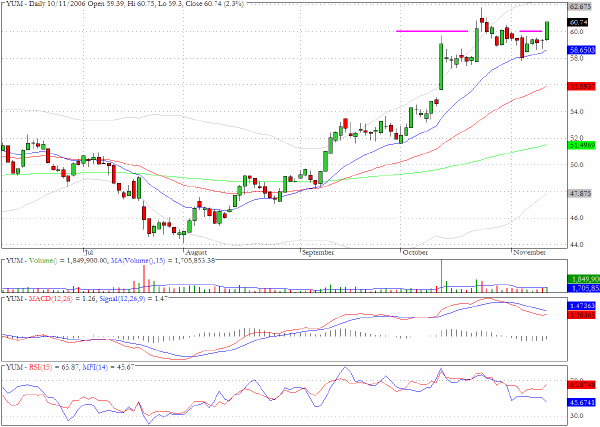
Yum Brands (YUM) moved up 2.3% on Friday and closed very close to its high for the day above $60 and at a new all time high.
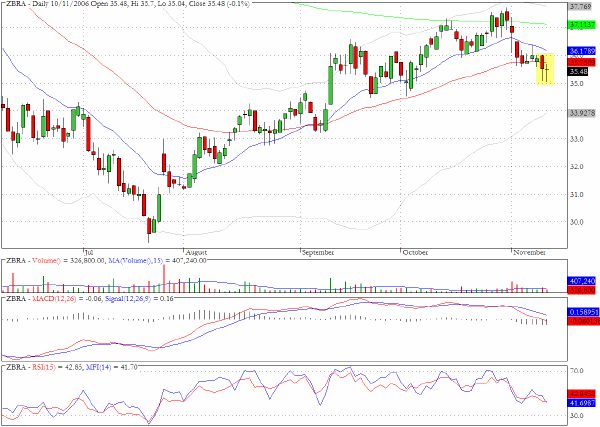
Zebra Technologies (ZBRA) failed to move back above the 50-day EMA in Friday's trading and a tiny body Doji candlestick was recorded.
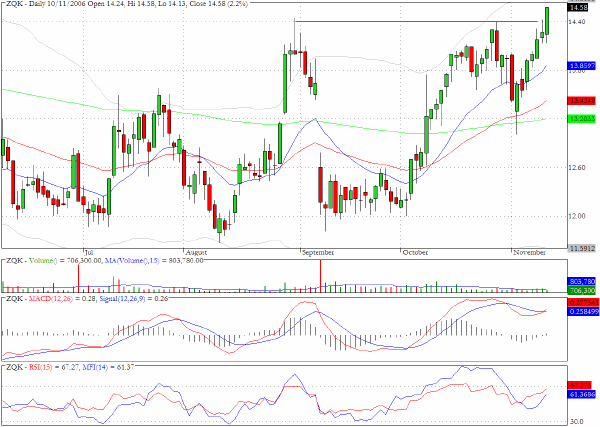
Quiksilver (ZQK) has an abbreviated form of the cup and handle pattern that we looked at for Verisign. Our concern about Friday's breakout was that it was accompanied by unexceptional volume and we shall be wathcing the stock this week for the technical nature of the follow through pattern.
Clive Corcoran is the publisher of TradeWithForm.com, which provides daily analysis and commentary on the US stock market. He specializes in market neutral investing and and is currently working on a book about the benefits of trading with long/short strategies, which is scheduled for publication later this year.
Disclaimer
The purpose of this article is to offer you the chance to review the trading methodology, risk reduction strategies and portfolio construction techniques described at tradewithform.com. There is no guarantee that the trading strategies advocated will be profitable. Moreover, there is a risk that following these strategies will lead to loss of capital. Past results are no guarante of future results. Trading stocks and CFD's can yield large rewards, but also has large potential risks. Trading with leverage can be especially risky. You should be fully aware of the risks of trading in the capital markets. You are strongly advised not to trade with capital.