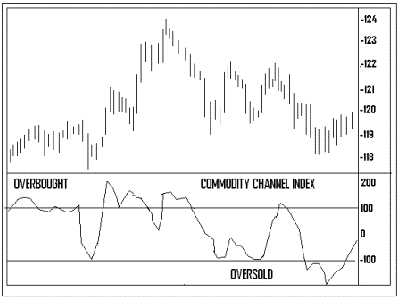
The Commodity Channel Index, or CCI, compares the current price with a moving average over a selected number of days, usually 20. Since oscillators can be normalized by dividing the values by a constant divisor, Donald Lambert chose to normalize the CCI by using a divisor based on mean deviation. His results have the CCI fluctuating in a constant range from +100 on the upside to -100 on the downside. Lambert recommended taking long positions in markets with values over +100, and short selling for markets below -100.
Most stock traders tend to use the CCI only as an overbought/oversold oscillator. When the CCI is used in this fashion, any reading over +100 would be considered overbought, and readings under -100 would be oversold. Lambert developed the Commodity Channel Index basically for commodities. However, Swing traders and Option traders often use it for trading stock index futures and options like the S&P 100. Twenty days is the most common default for the CCI, but the trader can vary the number to adjust its sensitivity. Below is a rough graph to show how a trader would view a CCI chart.

Andy Swan is co-founder and head trader for DaytradeTeam.com. To get all of Andy's day trading, swing trading, and options trading alerts in real time, subscribe to a one-week, all-inclusive trial membership to DaytradeTeam by clicking here.