The RSI is plotted vertically on a scale of 0 to 100. Most commonly in stock trading, our trader will set the overbought range to reflect moves above 70, and the oversold range would require a move under 30. When looking at the shifting that takes place in bear and markets, most often 80 becomes the overbought level in bull markets, and 20 the oversold level in bear markets.
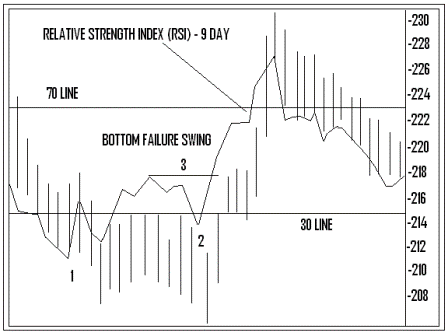
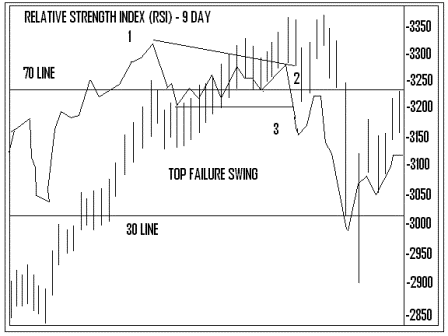
Relative Strength Index developer, J. Well's Wilder, Jr, calls RSI's above 70 or below 30 "failure swings". When a peak in the RSI over 70 fails to exceed a previous peak in an uptrend, followed by a downside break of a previous trough or valley, it is called a top failure swing. A bottom failure swing occurs when an under 30 RSI in a downtrend, fails to set a new low, then goes on to exceed a previous peak. Let's look below at rough charts of bottom and top failure swings respectively.

Note in this bottom failure swing pictured above, the second RSI valley or trough (Point 2) is higher than the first at Point 1 while it is still below 30 and prices are still falling. The bottom is signaled once there is a penetration of the RSI peak (Point 3).

In the above depiction of a top failure swing, the second peak at Point 2 is lower than the first (Point 1) while the RSI is still above 70 and prices are still rallying. A top is signaled by the break of the RSI line below the middle valley or trough at Point 3.
A serious warning that should always be heeded is when there is a divergence between the RSI and the price line when the RSI is above 70 or below 30. Wilder stated he considers divergence "the single most indicative characteristic of the Relative Strength Index". [Wilder, p. 70]
There are two technical analysis tools that can be used to detect changes in the trend of the RSI; trendline analysis and moving averages.
Some traders feel the greatest value of the RSI oscillator lies in failure swings or divergences that occur when the RSI is over 70 or under 30. One important point that should be brought to light in discussing the use of oscillators is that any strong trend, either up or down, usually produces an extreme oscillator reading before too long. In these cases, reacting to the overbought or oversold signals too soon can lead to an early exit from a profitable trend. Since a strong uptrend can result in the overbought market staying overbought for some time, it is best to look for other signals to confirm the decision to liquidate a position.
The first move into the overbought or oversold region of the RSI should be considered just a warning. However, closer attention should be paid once the oscillator moves into those danger zones a second time. Should the second move fail to confirm the price move into a new high or new low, which would form a double top or double bottom, a possible divergence exists. If the oscillator moves in the opposite direction, breaking a previous high or low, this confirms a divergence or failure swing.
The midpoint value of the RSI is the 50 level. It can act as support during pullbacks and resistance during bounces. Some traders even use the crossing of the 50 level to signal taking trading positions.
Andy Swan is co-founder and head trader for DaytradeTeam.com. To get all of Andy's day trading, swing trading, and options trading alerts in real time, subscribe to a one-week, all-inclusive trial membership to DaytradeTeam by clicking here.