Want to know what time of the year, on average, is the most bullish? I'll give you a hint - it just started. Yes, it's time again for the year-end optimism. With it comes good food, holiday cheer, and usually a lot of stock buying. So today, I'd just like to review some of the more interesting stats concerning what typically happens with the market beginning each November. As always, history is never guaranteed to repeat itself. However, there are also no coincidences when it comes to seasonal trends. The averages are what they are for a reason.
The Best Six Months
Depending on the index in question, usually the wisest thing one could do is buy into the market (the S&P 500) on the first day of November, and hold until the first day of May. That strategy alone, going back to 1950, would have netted you a profit of 4880% (that's a huge number, but remember, it covers more than five decades). If instead you would have bought on the first day of May, and sold on the first day of each November, you'd be up a paltry 34%. The point is, you would have done just about as well by being out of stocks altogether between May and October.
The Best Three Months
Want to get even more focused? We can even pinpoint the best three month period in the market. It's between November, December, and January. The S&P 500 has moved higher 16 out of the last 18 Decembers. That's tough to chalk up to coincidence, even if the market is supposed to go higher.
The Transition from The Best Three Months to the Other Half of the Best Six
OK, a little math may be in order here. The best three month period is actually part of the best six months. In fact, it's the first half (and usually the better half) of the afore-mentioned six-month strong period. Would it make sense to just forget February through April and just focus on November through January? Well, the idea isn't crazy.
Rewind all the way back to 1990. The market has suffered a major correction within the first few weeks of the year in twelve of the last fifteen years. This is not exactly a new occurrence. Historically, January has been very bullish, followed up by a terrible February. Lately, even January has been troubling. So do we need to change the 'best three-months' to the 'best two-months' (November and December) and forget about the rest of the year? Like we said, the idea isn't crazy, but we have to side with the long-term averages here. So, if you're playing the seasonal odds, January's best bet is still a bullish one, while February is usually trouble. And even if January does turn sour, it's rarely more than a mild consolidation period before the second part of the best six months.
The real question to ask is whether or not the February-through-April strength actually helpful to the bulls? Or is it just a case where the November-through-January rally is taking up most of the slack? Well, while February may not be great, you usually don't want to miss out on the March/April rally - they're almost always very positive months. In other words, it may be best just to ride out the February weakness, since we may not know exactly when the January rally will reverse, or when the March rally will begin.
The Grand Finale
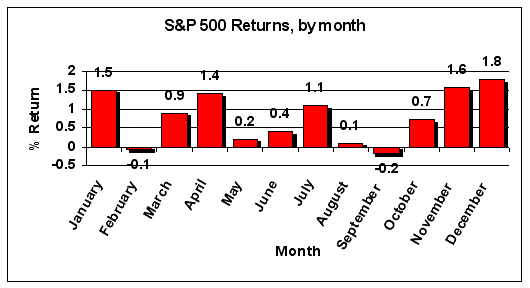
Maybe you're looking for an easier way to assemble all of this information? No problem - the chart below will lay it all out for you. It's the average month-by-month return for the S&P 500 going all the way back to 1950. It pretty much verifies all the things we said above.
S&P 500 Average Returns By Month (1950 to present)

The Bottom Line
I know a lot of you are skeptical about doing anything trading-related - at all - after this choppy, up-down-then-up year. I can't say I blame you. However, the reality is that this wasn't all that unusual. The indexes are pushing up to new highs, with September and October being rather anolmolous in rallying more strongly than their usual underperformance. he data above. Yes, our May and June this year were painful, and weren't 'supposed' to be. But the longer-term trends suggest that was an exception, not the norm. And you can't change your approach based on an exception to the norm. I'm rather confident about the next 6 months overall, though there couls be a short-term bullback along the way as the market is indeed very overbought. Any pullback shoul be a great time to get back on the horse, proverbially speaking. You'll be hearing a lot of gloom and doom from other places when the market has a sharp correction, but I've found that the heaviest doses of bearish opinions often come right around market bottoms, and right before big bullish trends.
Price Headley is the founder and chief analyst of BigTrends.com.