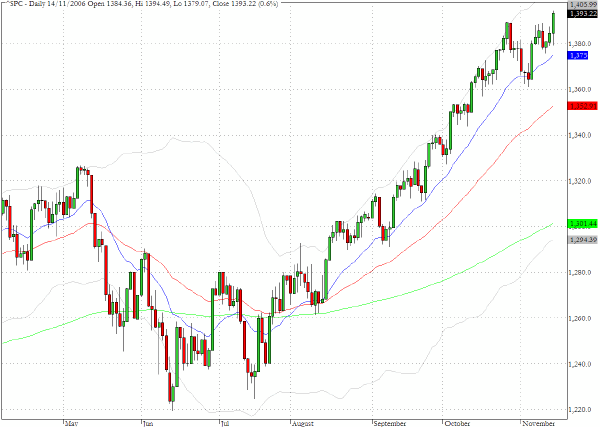
The indices surged ahead yesterday on a favorable reaction to an interest rate outlook from a Fed governor. The S&P 500 pushed through the resistance that had been apparent just above 1390 and managed to close at 1393, a new multi-year high, for a 0.6% gain.
Our scan of individual charts suggests that one of the factors driving yesterday's rally was some pronounced short covering of a number of stocks which had been showing signs of fatigue and potential vulnerability. There are plenty of traders doubting the sustainability of the advance since July to produce rather abrupt short squeezes when the news flow provides an excuse foot the bulls.
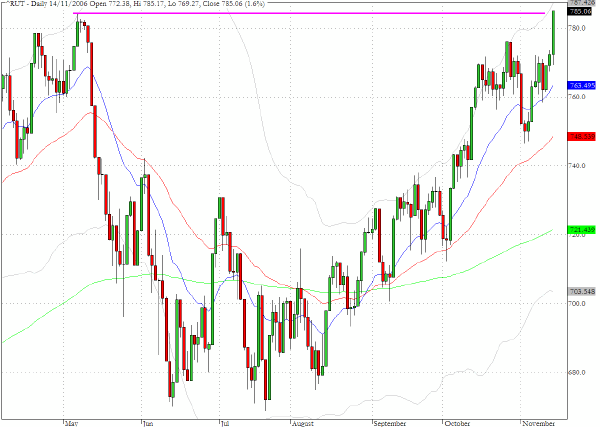
The Russell 2000 (^RUT) was the standout performer amongst the broad equity indices in yesterday's rally and with a 1.6% close a new all time high was registered just above 785.
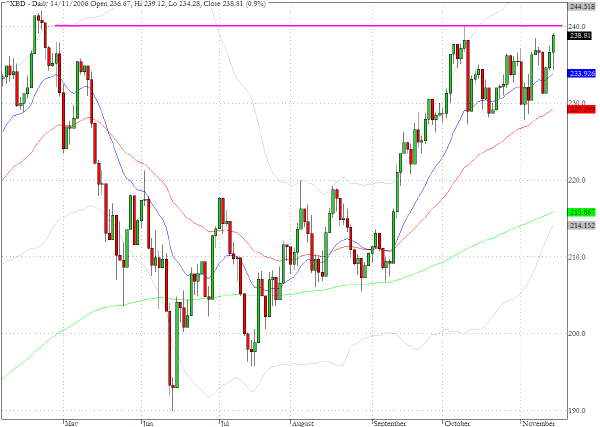
The broker/dealer sector has rallied right back to the late April levels that preceded the May sell-off and we will be monitoring the key stocks in the sector (GS,LEH,BSC,MER) in coming sessions to see how they perform as the index seems poised to break out to new highs.
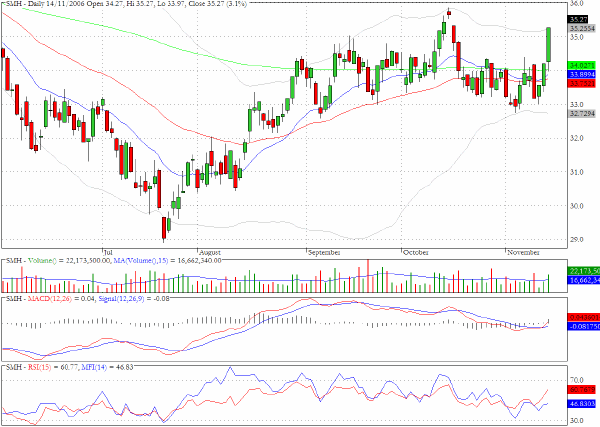
Many semiconductor stocks featured in yesterday's rally amongst the tech stocks. The sector fund, SMH, itself managed a more than three percent advance but there is still some way to go back to the $38 level that was touched in April.
TRADE OPPORTUNITIES/SETUPS FOR WEDNESDAY NOVEMBER 15, 2006
The patterns identified below should be considered as indicative of eventual price direction in forthcoming trading sessions. None of these setups should be seen as specifically opportune for the current trading session.
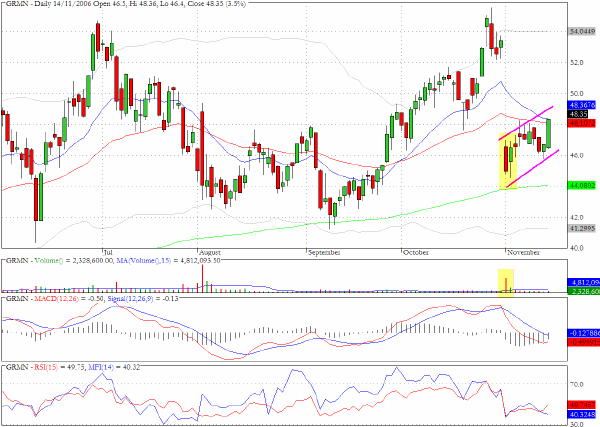
Even though the market dynamics would suggest that short opportunities need to be approached with caution, Garmin (GRMN) has a bearish looking pullback channel that may have run into resistance at the intersection of the 20- and 50-day EMA's. Especially notable is the subdued volume on the pullback since the early November sell-off.
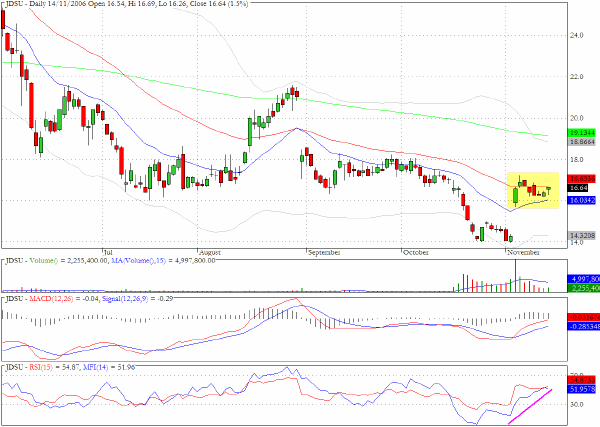
JDS Uniphase has a flag like pattern that suggests that the 200-day EMA could be a viable target in coming sessions.
Komag (KOMG) closed above $40 on heavy volume and could be headed back towards the levels seen in early July.

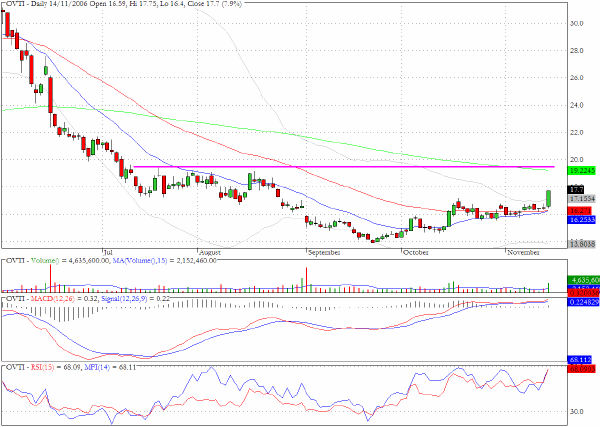
A continuation pattern could propel Omnivision (OVTI) towards the 200-day EMA level close to $19.
Clive Corcoran is the publisher of TradeWithForm.com, which provides daily analysis and commentary on the US stock market. He specializes in market neutral investing and and is currently working on a book about the benefits of trading with long/short strategies, which is scheduled for publication later this year.
Disclaimer
The purpose of this article is to offer you the chance to review the trading methodology, risk reduction strategies and portfolio construction techniques described at tradewithform.com. There is no guarantee that the trading strategies advocated will be profitable. Moreover, there is a risk that following these strategies will lead to loss of capital. Past results are no guarante of future results. Trading stocks and CFD's can yield large rewards, but also has large potential risks. Trading with leverage can be especially risky. You should be fully aware of the risks of trading in the capital markets. You are strongly advised not to trade with capital.