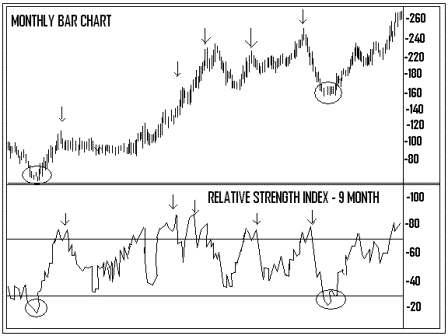
The Relative Strength Index (RSI) has horizontal lines, or levels, that appear on the oscillator chart. The lines are the 70 and 30 values. Stock traders often use those lines to generate buy and sell signals. In the RSI, a move under 30 warns the trader of an oversold condition. Let√Ę‚,¨‚"Ęs say our trader is looking for a buying opportunity. He or she watches the oscillator dip under 30, and then looks for a divergence or the development of a double bottom in the oscillator in that oversold region. If the RSI crosses back above the 30 line, our trader may take that as confirmation that the trend in the oscillator has turned upward and buy into a position. Likewise, in an overbought market, he or she may use the crossing back under the 70 line as a sell signal.

This rough graph above shows two major oversold buy signals (in ovals). Also note how the RSI line did a fairly good job of pinpointing important tops.
Andy Swan is co-founder and head trader for DaytradeTeam.com. To get all of Andy's day trading, swing trading, and options trading alerts in real time, subscribe to a one-week, all-inclusive trial membership to DaytradeTeam by clicking here.