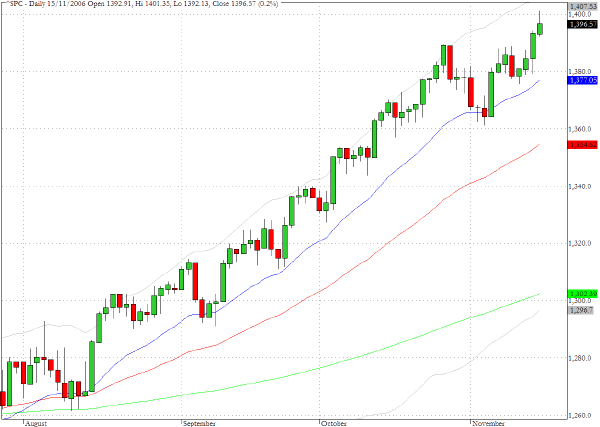
The S&P 500 cash index (^SPC) moved above 1400 in trading yesterday but closed at 1396 and in so doing registered a shooting star candlestick that echoed the formations found on the charts for the Nasdaq 100 (^NDX) and the Nasdaq Composite (^IXIC).
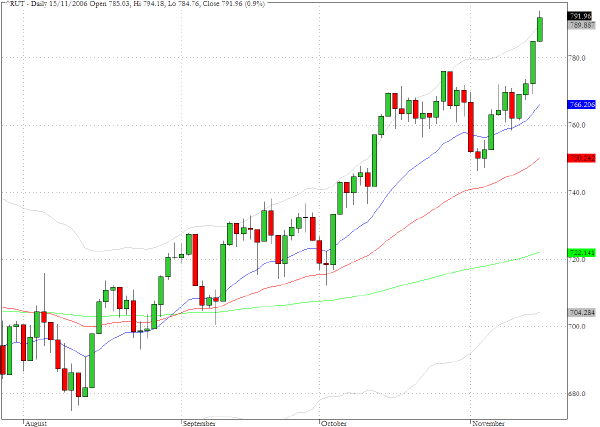
The Russell 2000 (^RUT) continued to outperform the other broad indices yesterday with a further 0.9% gain and finished the session at another all-time closing high very close to 792. The index has been re-energized since the beginning of November and its recent vigor has provided additional support and impetus to the overall bullish tone in the large cap indices.
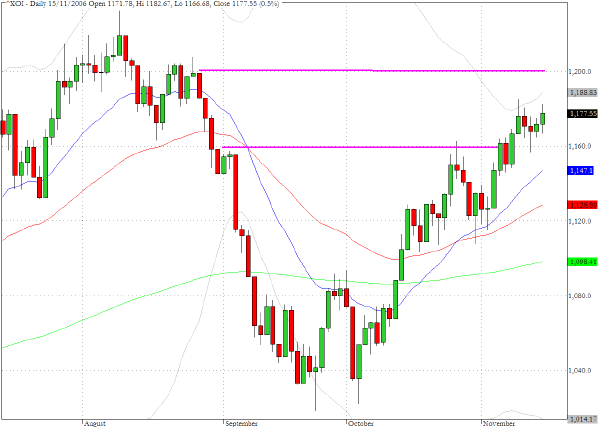
The oil index (^XOI) has navigated its way through chart resistance at 1160 and it now appears that it is headed back towards the previous highs above 1200.
TRADE OPPORTUNITIES/SETUPS FOR THURSDAY NOVEMBER 16, 2006
The patterns identified below should be considered as indicative of eventual price direction in forthcoming trading sessions. None of these setups should be seen as specifically opportune for the current trading session.
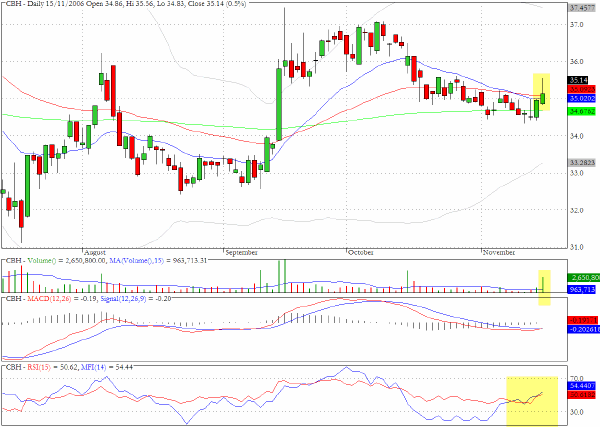
Commerce Bancorp (CBH) encountered resistance yesterday as it tried to break loose from the convergence of all three moving averages. The long upper shadow makes us somewhat cautious about entering on the long side but the volume and money flow characteristics suggest that a further upward push is to be expected.
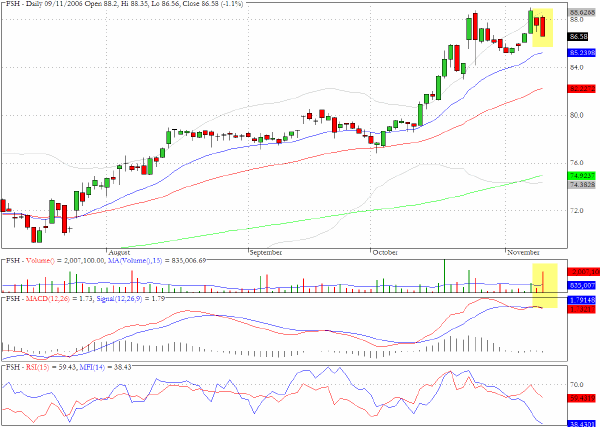
In Tuesday's trading Fisher Scientific (FSH) posted an inside day reversal formation and this was followed yesterday by a more decisive move downwards on heavy volume.
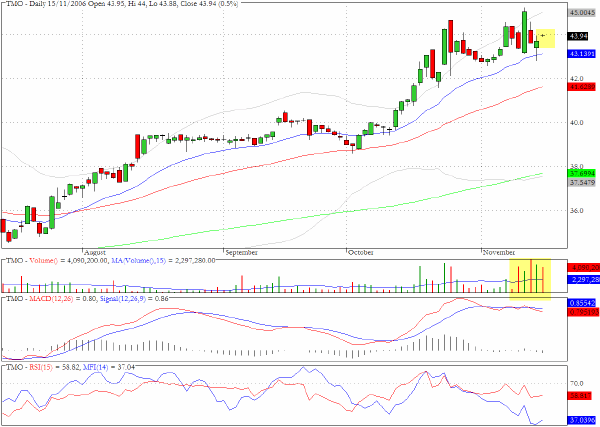
We commented on the reversal formations on the chart for Thermo Electron (TMO) earlier this week and yesterday a tiny Doji was formed. We will keep the stock on the Watch List in coming sessions as the volume remains above the 15 period SMA and the recent price behavior points toward a conflict that is in the process of resolution.
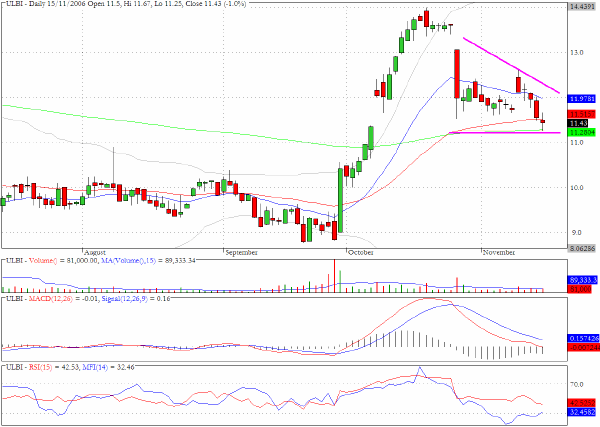
Ultra Life Batteries (ULBI) has traced out a descending wedge formation just above the 200-day EMA and the pattern suggests that there may be renewed selling following the long red candlestick from late October.
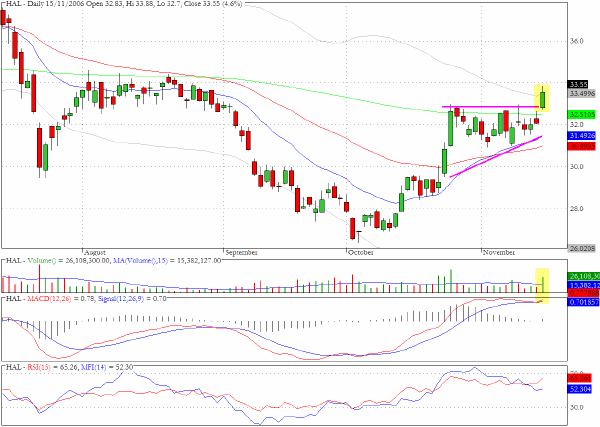
Haliburton (HAL) pushed above the recent range resistance and also closed above the 200-day EMA on above average volume yesterday.
Clive Corcoran is the publisher of TradeWithForm.com, which provides daily analysis and commentary on the US stock market. He specializes in market neutral investing and and is currently working on a book about the benefits of trading with long/short strategies, which is scheduled for publication later this year.
Disclaimer
The purpose of this article is to offer you the chance to review the trading methodology, risk reduction strategies and portfolio construction techniques described at tradewithform.com. There is no guarantee that the trading strategies advocated will be profitable. Moreover, there is a risk that following these strategies will lead to loss of capital. Past results are no guarante of future results. Trading stocks and CFD's can yield large rewards, but also has large potential risks. Trading with leverage can be especially risky. You should be fully aware of the risks of trading in the capital markets. You are strongly advised not to trade with capital.