NASDAQ Commentary
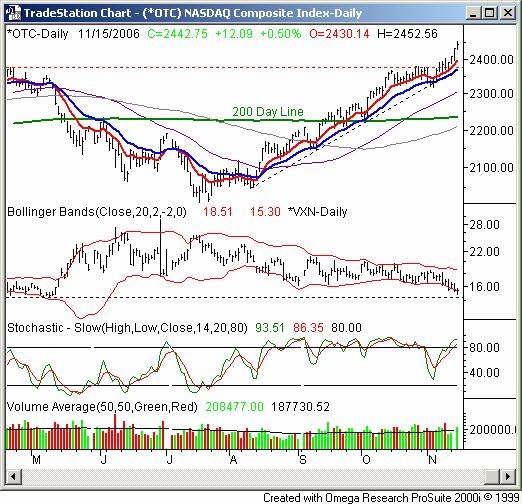
The NASDAQ's 0.5% gain on Friday added 12.09 points to its total, leaving it at 2442.75 for the day. That's a new high close for the year, and the intra-day high of 2452.56 was new as well. For the week, the composite is ahead by 53.03 points, or 2.22%. However, being over-extended as a result, we have to wonder if things are going to get reeled in as we roll through the last two days of this expiration week.
Put the "we're overdue for a correction" discussion aside for a minute - we want to think about the immediate future to get us through the end of this week. Tuesday's big gain and Wednesday's follow-through were great news for the bulls, but look at the divergence above the 10 day average line (red). Although this is the same line that has provided a rebound point for most of the last three months, we can also see that it kept the NASDAQ's strength in close check. Whenever the composite got more than 35 points or so above the 10 day average, a cooling off period soon followed, effectively giving the moving average line a chance to catch up. We're almost 50 points above the 10 day line as of Wednesday. If the pattern holds up, we should indeed see the NASDAQ reeled in for a few days.
That, however, has nothing to do with the bigger picture.
The fact of the matter is that the trend remains bullish, thanks to ongoing support at not just the 10- or 20-day lines, but also that long-term support line. It's currently at 2370 and rising fast. As stunningly unlikely as it seems to us, we can't assume any significant bearish turn until that level is breached.
With that in mind, there are two bearish forces likely to weigh in now. First, we're now back into stochastically oversold levels. And second, the VXN is back to low levels associated with a top, even more so than it has been over the last two months. Timing is everything though, so we'd really need to see the VIX rally, the stochastic lines roll over, and see the support line breached before starting to think too bearishly.
In the meantime, let's wait for a retest of the 10 day line before making any firm calls.
NASDAQ Chart

S&P 500 Commentary
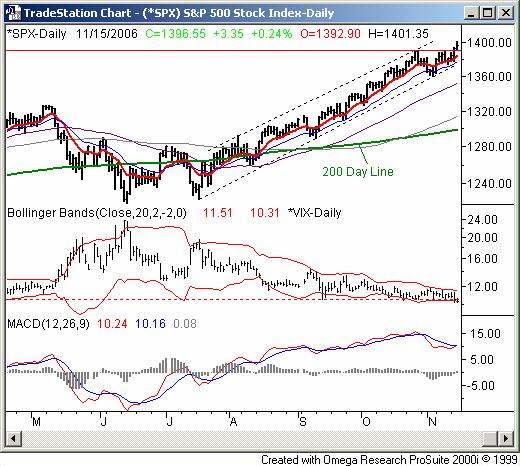
The S&P 500's resistance at 1389? Scratch it. We saw a high of 1394.50 on Tuesday, and a high of 1401.35 on Wednesday, when the SPX closed at 1396.55. That was 3.35 points higher (+0.24%) than Tuesday's close. On a weekly basis, the S&P 500 is up by 15.65 points, or 1.13%. The dip from early November has ended up being nothing more than a blip at this point, as traders have shrugged off the unlikeliness of this longer-term uptrend thanks to a wave of bullishly-interpreted economic data.
Our read here is the same as the NASDAQ's, a long-term support line (dashed), with the help of the 10 and 20 day moving average lines, has continued to propel the SPX upward. This week's gains have simply been 'more of the same', but have also led to a new buy signal - a bullish MACD crossover. In that sense, it's a challenge to not be fully bullish, especially knowing we're in a bullish season to begin with.
However, the hazards haven't changed. In fact, they've gotten worse. The VIX hit 10.14 on Tuesday, and 10.13 on Wednesday. You may recall we were lamenting the indices' bullish romp while the VIX failed to go lower? Well, that problem was addressed today - the VIX went lower. Yet, we can't help but theorize that a VIX this low still has more bearish implications than bullish one. The last time the VIX was this low was last year when it bottomed at 10.15 on December 16th. Two weeks later the SPX had dropped almost 20 points. We still contend something has to give soon, and we think an upward path for the VIX will be much easier to take than the path lower.
The other reality is simply the degree by which we're above the 200 day moving average line (green). You may recall a mention recently that being more than 6% above it often meant a significant pullback? Well as of today, we're 7.4% above the 200 day line, a very rare situation indeed.
And on a less objective note, we see the noose tightening around the VIX - in the form of contracting Bollinger bands. You've heard the idea that periods of low volatility are followed by periods of high volatility? The same could also apply to sentiment indices. If it's true, then we would expect to see the VIX really start to move a lot very soon, causing the bands to widen. Of course, all that room for upside volatility strengthens the bearish argument.
In the meantime, the support area - currently at 1375 and rising - will be the key to actually realizing any of this bearish potential. The trend actually remains bullish until and unless.
S&P 500 Chart

Dow Jones Industrial Average Commentary
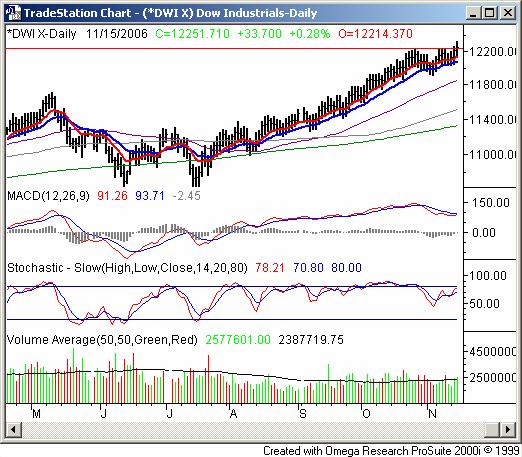
The Dow Jones Industrial Average's close at 12,251.71 on Wednesday was the result of a 33.7 point (+0.28%) gain, a fourth straight gain, and the second gain made on respectable volume. Along the way, a new year high of 12,326.07 was touched, unraveling our argument about the potential resistance at 12,236. For the week, the Dow is up 143.28 points, or 1.18%, thanks to ongoing support at the 10 and 20 day lines (red and blue, respectively).
Other than that, the analysis above basically applies here as well.
Dow Jones Industrial Average Chart

Price Headley is the founder and chief analyst of BigTrends.com.