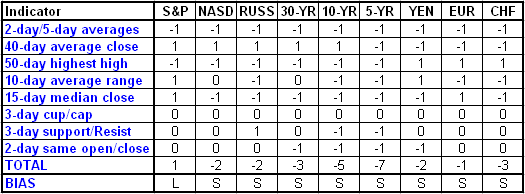
Today we begin posting the Daily CzarChart. This is a simple table that predicts the open-to-close move for the next day based on the interaction of eight individual indicators.
The total is the net total of the eight signals. The bottom line gives the direction of the bias. LONG (L) is anything over zero; SHORT (S) is anything under zero. Whether you do better waiting from more confirming signals as opposed to a simple majority is something, we'll discuss in days ahead. That is, will a +3 bias do better than a +1 bias?
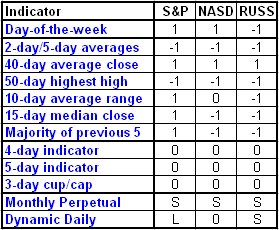
The second chart is the existing intraday index system we've been followingâ€"henceforth to be known as the Dynamic Monthly.
Daily CzarChart
The bottom row provides the direction of the bias at the open: long (L) or short (S). When it's neutral, it will read zero (0). Click here for a more in-depth explanation of the rules.

Dynamic Monthly Biases for June 20
Hold all positions (Short Nasdaq and Russellâ€"long S&P).
The bottom two rows determine the signal. Dynamic Day One trumps everythingâ€"you always follow it. When it's neutral, the Monthly Perpetual provides the direction. Click here for a more in-depth explanation of the rules.

DISCLAIMER: It should not be assumed that the methods, techniques, or indicators presented on in this column will be profitable or that they will not result in losses. Past results are not necessarily indicative of future results. Examples presented on this column are for educational purposes only. These set-ups are not solicitations of any order to buy or sell. The author, Tiger Shark Publishing LLC, and all affiliates assume no responsibility for your trading results. There is a high degree of risk in trading.
Art Collins will be speaking at the Chicago Trader's Expo on Saturday, July 16, from 8:00 to 9:30 a.m. The presentation is Identifying, Combining and Profiting from Daily Biases in the Futures Markets. E-mail Art at artcollins@ameritech.net.