Expiration week ended up being bullish, with the S&P 500 as well as the Dow both breaking above key resistance lines (the NASDAQ Composite didn't have horizontal resistance to speak of). The VIX and the VXN also both sank to even lower lows. The indices remain overbought, while the VIX and VXN are both at extreme lows typically associated with a top. But, for about the fifteenth week in a row, both of those bearish factors have been shrugged off as traders sent the market higher. The thing is, despite the pressures against it, the coming week (a shortened holiday week) is traditionally bullish as well. So, we won't be shocked to see more of the same upside. We just wanted to set the theme in place as you read through our opinions on our charts.
NASDAQ Commentary
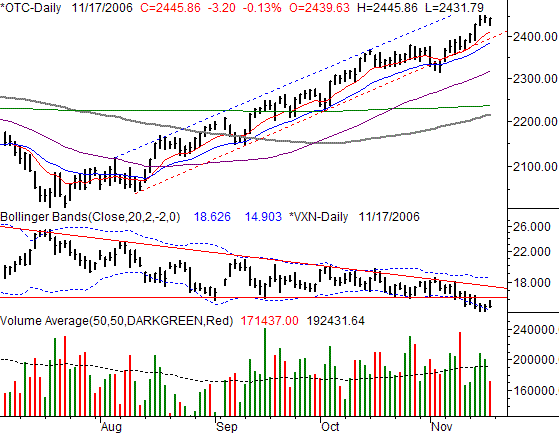
The NASDAQ actually lost ground on Friday, losing 3.2 points (-0.13%) to close at 2445.86. For the week, the NASDAQ Composite gained 56.14 points (2.35%)...the best performance of all three indices. Yet, we have to wonder if Friday's lagging was a red flag. The NASDAQ leads the market - both up and down. And truth be told, the composite did well to only close slightly lower. The range was lower, and the index spent most of the day much deeper in the red than that - a late day rally salvaged Friday. On the other hand, the NASDAQ remains within a bullish set of trend lines, so the trend is still to the upside, technically.
There's plenty of support between 2373 and 2412. It's comprised of the 10- and 20-day lines and/or straight line support (red, dashed). Unless the NASDAQ decisively breaks under that lowest part of that support zone, then we wouldn't worry too much about any short-term dip. On the other side of the chart, resistance (blue, dashed) is at 2494 and rising. So, there's plenty of room for more short-term upside before the composite necessarily hits a wall.
As for the VXN, it's still a thorn in our side. Stunningly, it broke under support at 16.20 last week to close at 15.33. We saw a slightly higher range for the VXN in Friday. A bearish hint? Not exactly - it still closed lower than Thursday. As far as the VXN is concerned, we'd say keep watching for a break past the resistance line at 17.45 before assuming the composite is really headed lower. By the point in time that would actually happen, the NASDAQ would have had plenty of time to sink back to and under its support lines.
Volume, although choppy, remains bullish.
NASDAQ Chart

S&P 500 Commentary
The S&P 500's gain of 1.45 points (+0.1%) on Friday left at at 1401.20 for the week. On a weekly basis. the index closed 1.47% higher (+20.30 points) than the previous week's close. All in all, the SPX is still in the bullish zone it's been in since August. So despite the all the bearish bullets being fired still to this day, the market has thus far been bullet-proof. It's got to end sometime, but as we've said about a billion times in the last four months, now ain't the time.
The lower edge of the bullish zone - the support line - is currently at 1382 and rising. It's the blue dashed line below. The resistance line is at 1415 and rising as well...the broad red line you see below. As long as the SPX stays in that relatively mild upward slope, the bulls and the bears have found a happy medium, with neither team getting overly anxious (or nervous) along the way. That's why the trend has managed to persist as long as it has.
But, last week, the VIX finally broke under support at 10.30, and stayed down there, closing at 10.05 on Friday. The direction is bullish, but wow, how much lower can it go? At the same time, the SPX followed through on the cross above the 10-day moving average line. Although, we're stochastically overbought, the bulls may see a little short-term relief in that the upper edge of the bullish zone has not yet been hit. That may well be the room needed in the coming week for just a little Thanksgiving rally.
The S&P 500 is now 7.7% above the 200 day moving average line - a statistical rarity, and one of the reasons we think the index could get reeled in very soon. But, stick with the overall momentum until it's clear the sellers are actually going to get some traction.
S&P 500 Chart

Dow Jones Industrial Average Commentary
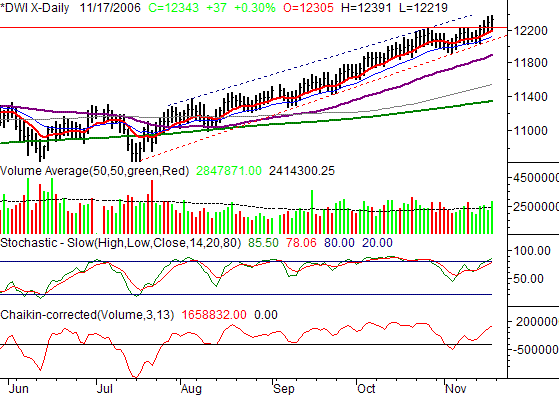
The Dow Jones Industrial Average gained 37 points on Friday to end the week at 12,343. That 0.3% gain on Friday meant a 1.94% gain for the week, a 235 point improvement on the previous week's close. And, as we've seen for most of the year from the Dow, these blue chips continue to offer consistent gains with relatively little volatility.
Truthfully, if we weren't staring a low VIX/VXN in the face, we'd have to say this chart was extremely bullish - it has all the right qualities we would need to say things are likely to continue this way. Volume has been good into the rallies, and increasing along the way. And the momentum has clearly been to the upside. All in all, the Dow looks poised to keep moving higher at this measured pace.
Perhaps the VIX and the VXN are irrelevant at this point, at least as far as these blue chips are concerned. Clearly investors don't have a problem with being stochastically overbought, as we saw in October.
Dow Jones Industrial Average Chart

Price Headley is the founder and chief analyst of BigTrends.com.