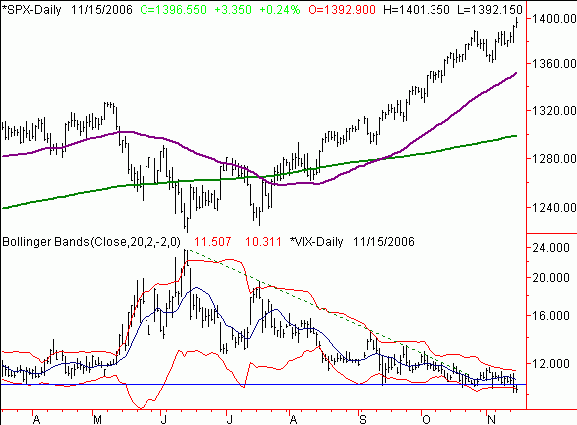
As the stock market makes new highs, we've just now seen the CBOE Volatility Index (VIX) make a new low for the year these past couple of days. With the Consumer Price Index (CPI) report due Thursday morning before the market opens, I'm inclined to not trust this latest upside breakout Wednesday as much as I normally would, thanks to the lack of fear among most investors.
As you can see from the chart below of the S&P 500, the market has made new highs here. Meanwhile, the VIX just tagged new lows for the year, and the past two days have seen the VIX touch the lower 20-day Bollinger Band. This defines a RELATIVE low that often leads to a cooling off period during an uptrend like we are in. So don't be surprised if the market does not react as favorably post-CPI report as most clearly hope.
Another interesting development is how narrow the Bollinger Bands have become in the past few weeks. This narrowing has occurred as the VIX stays low, lulling investors to sleep to no longer worry about an increase in volatility. Increases in volatility (usually, but not always) occur due to market declines. So I think it's safe to say that volatility is likely to not only see a spike to the upper bands in the next few months, but could also shoot higher as volatility trends up, like in did in May & June earlier this year.
Daily Chart of the CBOE Volatility Index (VIX) vs. the S&P 500

What could cause volatility to stay low? If the market continues to get good news on the inflation front, good news from the Fed, good reactions to earnings and continues to make higher highs and higher lows as a result, then the anticipated volatility rise could be further delayed. Also, as we noted at the beginning of this week, we are now in the bullish seasonality period from November through next April. But that does not mean we can't have a correction at some point, especially with how strong the market was in the normally weak September-October period this year.
The big key as a trader is that you keep this big picture awareness in the back of your mind, but you don't act on it (to the downside in this case) until the market starts to confirm this scenario by making closes under the prior day's lows. For now that has not been seen, and the bulk of our gains continue to come from the call side. But looking at useful sentiment tools like the VIX told us to lighten up on bullish bets right in front of the CPI report - we can always add bullish exposure if the market continues to react favorably after the news, while keeping us flexible to beginning to add puts if the market sells off after the news.
Price Headley is the founder and chief analyst of BigTrends.com.