As we head into a shortened trading week due to the Thanksgiving holiday, the indices over the last few sessions are displaying narrow range characteristics. The underlying bullish tone suggests that while there may be not much of an appetite for aggressive exploration of higher ground the active buying support that emerges on signs of weakness acts as a check on the index traders that want to test the downside.
On Friday, the S&P 500 moved up 0.1% and closed above 1400 for the first time since 2000. The highest close recorded on this index is 1527 and dates back to March 2000 and we are now less than ten percent from this target.
I wish my North American readers a happy Thanksgiving holiday and we will return on Monday 27.

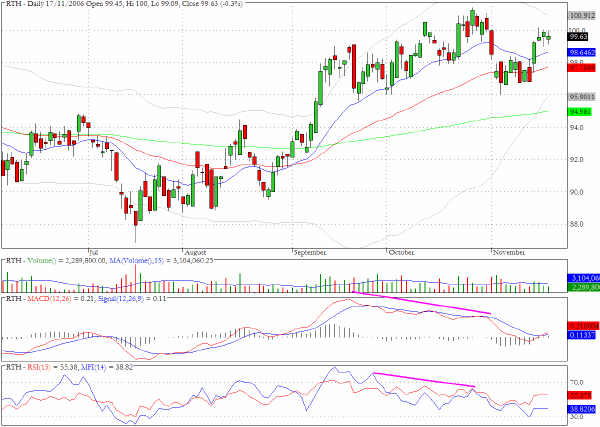
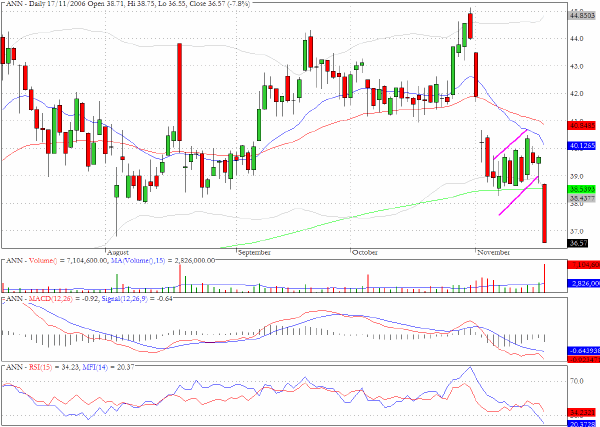
We have mentioned before the negative divergences in the chart for the retail sector fund, RTH, and in reviewing some individual retailers we see some signs of vulnerability. Walmart shows a potential failure pattern and as we discuss below Ann Taylor was sent abruptly lower on a flat sales forecast.
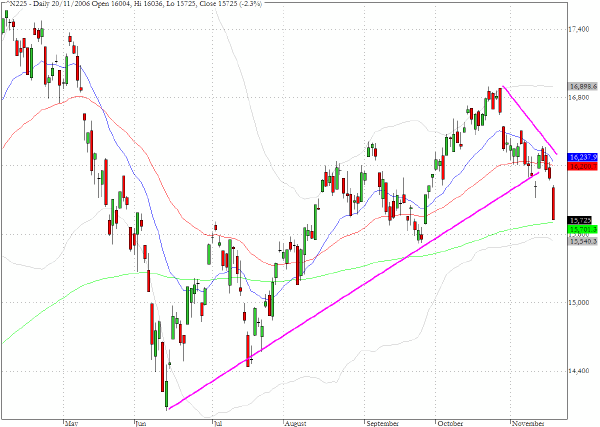
We have included the chart for the Nikkei 225 (^N225) which has already concluded trading for Monday 20th. The index suffered a rather steep loss today of 2.3% and the uptrend since the summer lows appears to be in the process of being violated. The banking sector was one of the main casualties although commentators seemed unable to find any obvious fundamental factors to explain the sell-off.
TRADE OPPORTUNITIES/SETUPS FOR MONDAY NOVEMBER 20, 2006
The patterns identified below should be considered as indicative of eventual price direction in forthcoming trading sessions. None of these setups should be seen as specifically opportune for the current trading session.
Ann Taylor (ANN) one of the weak retailers that we alluded to above released a disappointing sales forecast and saw its shares plummet by more than seven percent. The chart formation reveals a well defined bearish flag/channel formation.
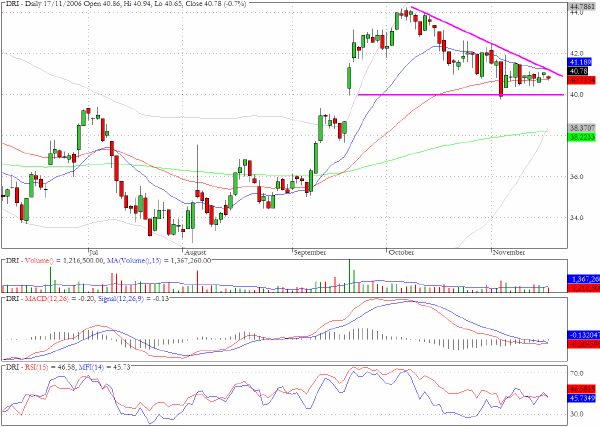
Darden Restuarants (DRI) is in the closing stages of a descending wedge formation that is bounded by the $40 level which marked the breakout level from mid September.
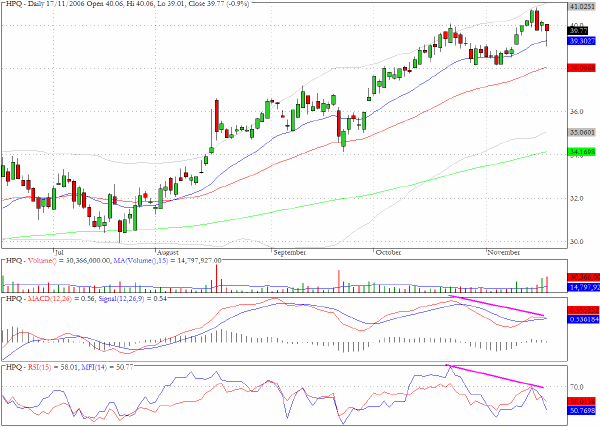
Hewlett Packard (HPQ) has clearly divergent patterns on both the MACD and MFI chart segments.
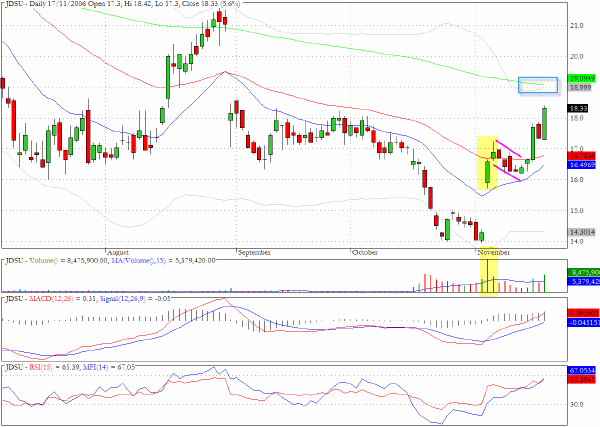
A week ago we cited the flag like pattern for JDSU and suggested that the 200-day EMA could be a viable target which now seems close to completeion.
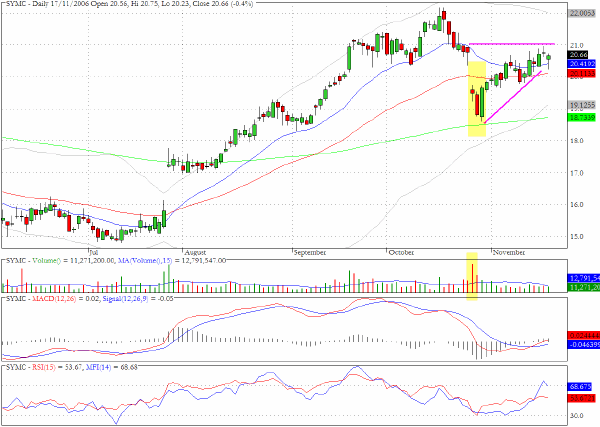
Symantec (SYMC) could face renewed weakness in the vicinity of $21.
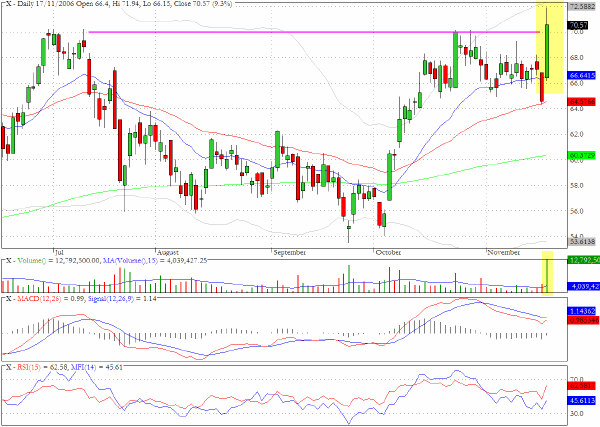
US Steel (X) powered ahead by more than nine percent on three times its average daily volume and looks as though it is sufficiently energized to make it through the $70 barrier.
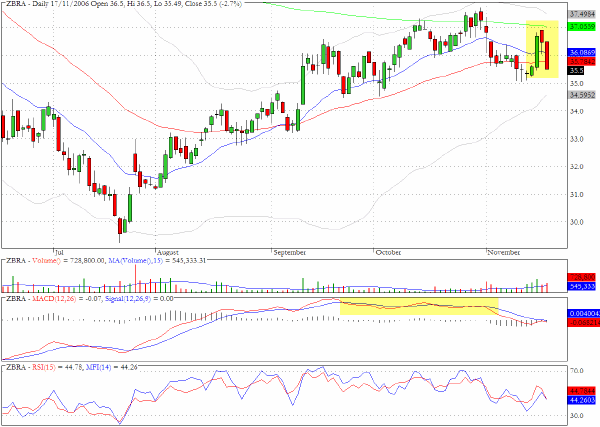
Zebra Technologies (ZBRA) produced acute reversal behavior at the end of last week as it "failed" to break above the 200-day EMA. If we see further attempts to break above $37 this week they should be monitored closely as the momentum and money flow are waning.
Clive Corcoran is the publisher of TradeWithForm.com, which provides daily analysis and commentary on the US stock market. He specializes in market neutral investing and and is currently working on a book about the benefits of trading with long/short strategies, which is scheduled for publication later this year.
Disclaimer
The purpose of this article is to offer you the chance to review the trading methodology, risk reduction strategies and portfolio construction techniques described at tradewithform.com. There is no guarantee that the trading strategies advocated will be profitable. Moreover, there is a risk that following these strategies will lead to loss of capital. Past results are no guarante of future results. Trading stocks and CFD's can yield large rewards, but also has large potential risks. Trading with leverage can be especially risky. You should be fully aware of the risks of trading in the capital markets. You are strongly advised not to trade with capital.