Since the October 2002 low point, investors have been enjoying quite a persistent up-trending market that has barely corrected. In fact, during this time, the deepest correction phase occurred in the summer of this year as the market lost only 8% of its value, according to our main benchmark S&P 500. There were a number of areas on the way up that presented some real technical challenges, although the markets did react to these challenges, the reactions were only temporary in nature, as the market continued to inch higher over time. With the exception of the last month, "inching higher" is what characterized the up-trending environment throughout the last 4 years, as we did not really get bull-market style rallies that seemingly shot-up into the stratosphere with little or no let-up. Trading ranges were often narrow and volatility was at historical lows. Despite some concern coming into a number of key technical areas of resistance on the way, I have always given the benefit of the doubt to the bulls, as I tell my students and write here often that we must always respect the trends. I have had enough doubt in the past to fall short of interpreting my charts as intermediate-term sell, just to make sure that I give the maximum benefit of the doubt to the trends since the 2002 low point.
Now this is about to change. I'm not talking about losing respect for the direction of the trend, as this should be a permanent condition on our part, but rather about giving the benefit of the doubt to the bulls. This move to new Multi-year highs recently has reached a point that is impossible for me, for now, to trust. The market has reached some levels we had been anticipating for quite some time now, and it's time to the ring the bell on the intermediate-term sell-side of the markets. Based upon a host of technical studies I have put together in recent articles and the levels at which the market has reached, I have an intermediate-term sell signal on U.S. equities today. Rather than a flat-out signal to open new short positions to challenge the market, as this is a very risky thing to do, this is best interpreted by longer-term investors as "a good time to take profits off the table" and for shorter-term traders as "a major change in environment favoring bear side that is likely to persist for many months."
This intermediate-term sell signal remains in place so long as the markets do not give us sustainable trading as measured on the monthly charts above the following resistance points: 1400 S&P 500, 12300 Dow, and 1800 NDX.
Let's take a look at some charts:

Chart Notations:
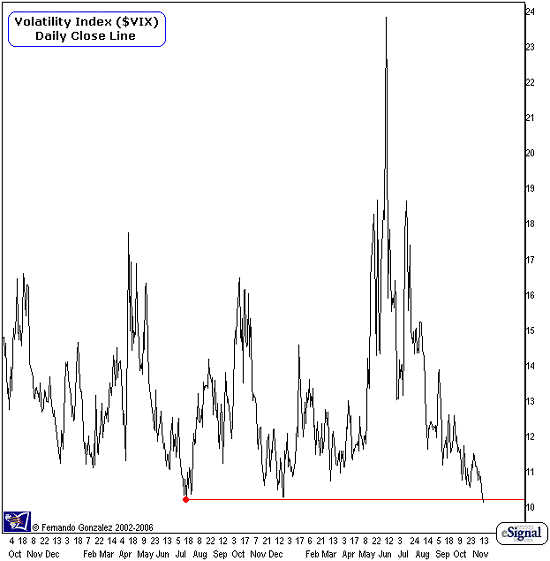
- The daily close line chart of the CBOE Volatility Index ($VIX) addresses the intermediate-term time horizon.
- Note that the VIX has moved to a new daily closing point here, and that is a 10+ year low close. Although the market saw slightly lower levels in 2005, it did not manage to close at those low points.
- The VIX is a unique oscillator that does not quite yield actual buy and sell signals (timing) as much as "change in environment" signals. It just happens to be here that this closing low point we see today happens to coincide with a sell signal on my equity indices.
- At this point the VIX is very vulnerable to spikes, which correspond to market sell-offs. It appears that the spike in the VIX this year is perhaps the warning signal that a change in environment has arrived, and that the market is likely to react to its own horizontal support and resistance points with a greater degree of violence.

Chart Notations:
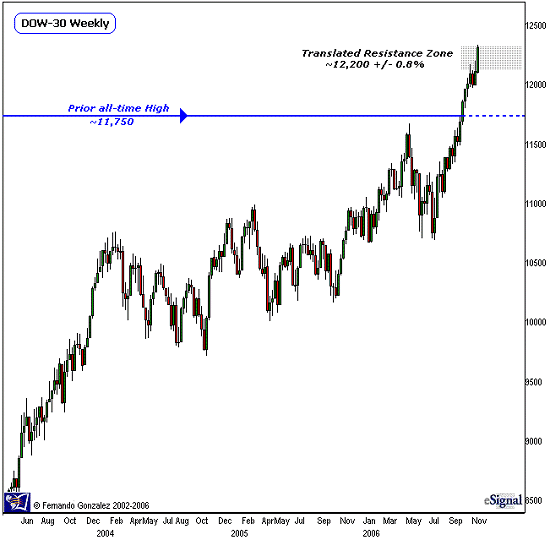
- The Weekly chart of the Dow above addresses the intermediate-term time horizon.
- In gray we have marked off the resistance area which we have translated over from our measurements on the S&P 500. This appeared in one of my September newsletters. Note that since the Dow is trading at all-time highs and literally into "uncharted territory" the translation of support and resistance with a related market, in this case the S&P 500, is very important in applying resistance.
- The Dow has reached the upper-end of our target zone, just one of the many reasons which supports my intermediate-term sell signal, but this is especially important, since the Dow is the upside leader among the major measures of the market.

Chart Notations:
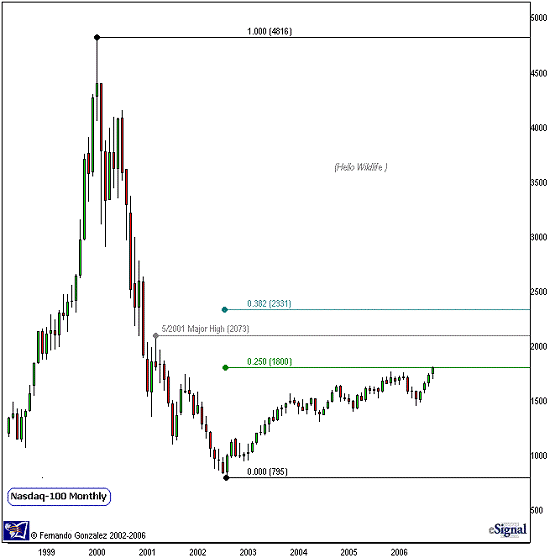
- The monthly chart of the Nasdaq-100 addresses the intermediate-term time horizon
- The attempt to recover from its monumental faceplant in 2000-2002 has now finally been repaired by 25%. That means the Nasdaq has now woken up from its seemingly comatose state and is "up on its knees." Will it have enough "legs" to "stay up?" At some time in the future I have little doubt that the Nasdaq will once again trade into and even exceed much further beyond its all-time highs, but as for now, it is still the most vulnerable segment of the markets, particularly at current levels.
Fernando Gonzalez is in his 10th year as an active trader, technical analyst and content contributor to the active trading community and a long list of popular financial media. Online Trading Academy trading knowledge...your most valuable form of capital.