As we continue to follow-up on the market's progression during these critical levels of both price and time, we observe an increasing degree of complexity in price behavior over the last several trading days. In switch of relative strength, which we might label for now as simple as short-term rotation, the Nasdaq (as measured by the NDX) has picked up enough strength to have moved into a new multi-year high point, right along side the Dow. It is quite interesting to note that our overall leader for the last 4 years, the S&P 500, a much broader measure, is trailing behind.
Let's take a look this week at the Nasdaq across some different time horizons, determine the current environment, and what we can expect ahead:

Chart Notations:
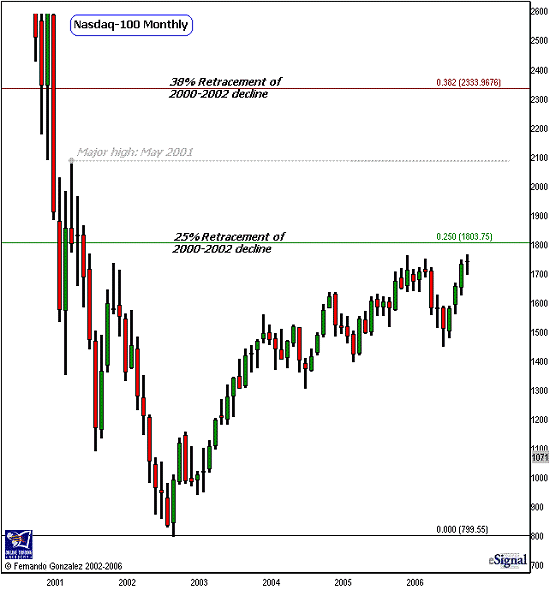
The monthly chart of the Nasdaq-100 above addresses all time horizons
Most are aware that in the larger picture, the Nasdaq is very weak in comparison to other markets, and in fact has not been able to retrace even 25% of the damage done by the decline from the 2000-2002 decline (84% loss in value). The green line above marks that 25% retracement point, which happens to also coincide with the milestone 1,800 mark.
The Nasdaq is certainly within very close proximity to that area and also happens to be carrying enough momentum to make it there. As we approach, it is important to take note of the added levels of risk that accompanies this measure, particularly in light of our prior discussions on the technical aspects of the S&P 500 and Dow, all of which are now 4 years deep into quite a consistent uptrend with little or no interruption. Let's take a look at this in a bit more detail and zoom into smaller time horizons:

Chart Notations:
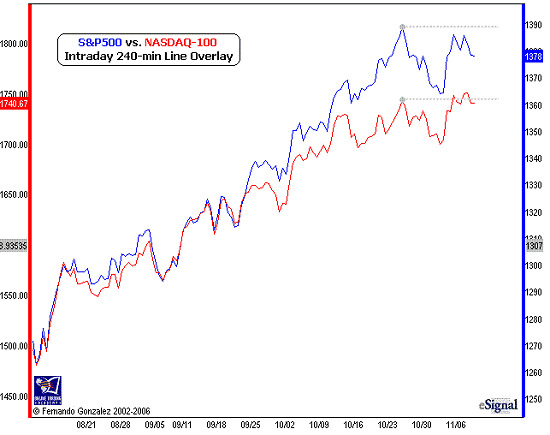
The intraday 240-minute line chart above compares the Nasdaq-100 (red) and S&P 500 (blue) over a period of approximately 2 1/2 months. Please see notations below on 240-minute charts.
Over the short-term, the broader S&P 500 is clearly the leader in the uptrend above, however recently, note that the Nasdaq has enough momentum to have broken through to a new high (relate to gray lines above). This is a technical "bait and switch" in relative strength, an early stage of "rotation" if you will. Based upon the key technical resistance points in the S&P 500 as the leader, the rotation of strength that has moved into the Nasdaq at this early stage is not likely to be long lived, and probably limited to the 1800 mark as discussed in the previous chart. Let's take a look at this in a bit more detail so as to have a good short-term directional guide:

Chart Notations:
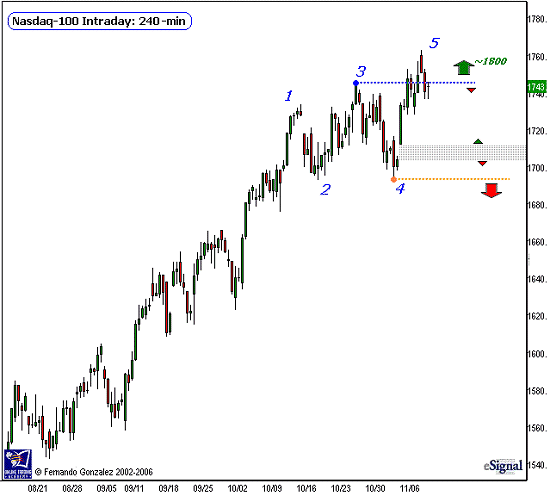
The Intraday 240-minute chart of the Nasdaq-100 above addresses the short-term time horizon.
Note that because this is a 240-minute chart that does not include overnight data, each of these bars alternates between 4-hour and 2 1/2-hour summaries. Although 240-minute charts are best suited for liquid 24-hour markets such as the Forex market, occasionally I will use them for regular equities when the 60-minute charts are showing too much detail and the dailies show too little. This is one of the those times, only to display some patterns we are addressing with a bit more clarity.
Notice that the Nasdaq has entered into a broadening range formation here. The range is expanding as we get an alternating series of higher-highs and lower-lows at once. We mark each point in the formation for a corresponding number.
In the broadening range formation, magnitude (each move from point-to-point) is not the only consideration. Speed plays a very important role, thus, not only do we have to have a broadening in price, but in time as well. Note on the Nasdaq above that the speed from point 4 to point 5 is very fast and exceeds that the prior moves. This suggests that the broadening sequence is out of play and that the market is in progress towards a new impulsion.
In plain English, that means that the risks to up side are very high, particularly if the Nasdaq is trading above point 3 (blue dotted line). As long as the market is trading above point 3, the short-side of the market is much higher risk than the long-side, all the way up to the 1,800 level as discussed in the prior chart.
As we look towards the other direction (trading below point 3) take note of the gap underneath the market (gray area) - this is the most probable short-term destination of the market, should trading below point 3 continue. Trading below the gray area takes the market to the brink of rolling-over on the larger time frames to produce a decline with a magnitude unseen since the 2002 low point. Let's see how it all plays out, tread carefully and maintain a high degree of flexibility at these times, as the risks are very elevated across multiple time frames and markets.
Fernando Gonzalez is in his 10th year as an active trader, technical analyst and content contributor to the active trading community and a long list of popular financial media. Online Trading Academy trading knowledge...your most valuable form of capital.