The last five trading days in the market have produced the second largest sell-off we have seen in the market since the July low point, using the S&P 500 and the Dow as main barometers. As many might already know, the US equity market has been in quite an awesome short-term uptrend since that month. Not surprisingly however, the Nasdaq already has a head start in reacting downward to our expected resistance points, as it has (as of today) matched the strongest 5-day sell-off since the July low point.
Over the last couple of newsletters, we have been discussing the crucial levels the markets are at today. They are pushed-up right against some very key resistance points, and the levels of risk are elevated, as far as long-term point of view is concerned. In the last several days, we have seen the markets give us a reaction to these resistance areas, particularly the 1384 zone in the S&P 500 as well as the 12,100-12,300 zone in the Dow. It is too early at this point however, to establish that market top is in, with a good degree of confidence. Let it not be lost on us that the business of picking tops is a dangerous one, as Wall street has demonstrated to us a multitude of times in the past. We should therefore tread carefully, in making any directional assumptions. Increasingly, however, the market continues to show signs of critical mass, as it sits here, deep into a very long, 4-year uptrend.
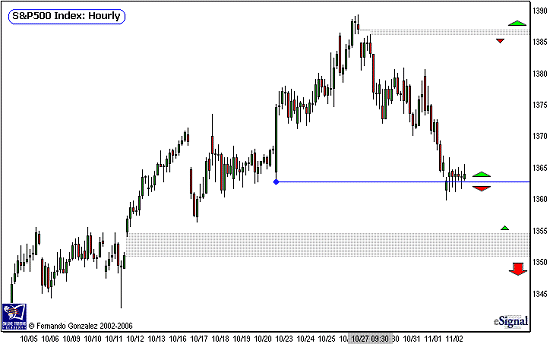
This week, we will take more of a zoomed-in view versus our most recent charts, which addressed much larger time frames. Let's start with an hourly chart of the S&P 500:

Chart Notations:
The hourly chart of the S&P 500 above addresses the very short-term time frame (up to 10TD)
Note that the market sits at the bottom of 2-week range, and has been able to retrace the most recent upward impulse (base of the blue line). It sits at support here and the market is no larger downside threat so long as trading remains above that point.
Movement underneath our blue mark opens up a small move to the next short-term technical stop underneath the market to an open gap left from October 11 (lower gray area).
We mark the gray area underneath as a neutral zone. Note the large red arrow underneath the neutral zone: this represents a sizeable decline, much larger than any we see here on the chart, if the market is able to move and sustain trade underneath this neutral zone.

Chart Notations:
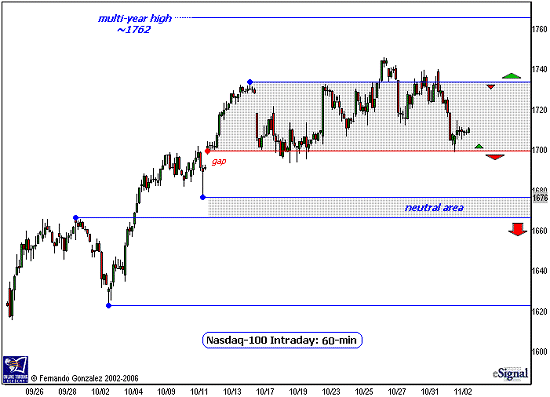
The Hourly chart of the Nasdaq-100 above addresses the very short-term time frame (up to 10TD)
Note that the Nasdaq has been trapped inside a range for about 3 weeks now (upper gray area), and it sits near the bottom of the range. Just like the S&P 500, we will treat this area as support, and use the open gap from Oct 11 as a marker (red). This area also happens to sit at the milestone 1700 mark.
As the markets are larger resistance points today, let's keep an eye on our marker, as any sustained trade below puts the Naz into Bear land for a move to the next neutral zone underneath (lower grey area), our arrows mark the rest of the directional biases.
Fernando Gonzalez is in his 10th year as an active trader, technical analyst and content contributor to the active trading community and a long list of popular financial media. Online Trading Academy trading knowledge...your most valuable form of capital.