I don't look at it too often, as it's more of an investing philosophy than a trading one. However, we've also seen how some great short-term trades can turn into great long-term investments. And, we've also seen the opposite of great investments turned into great trades.
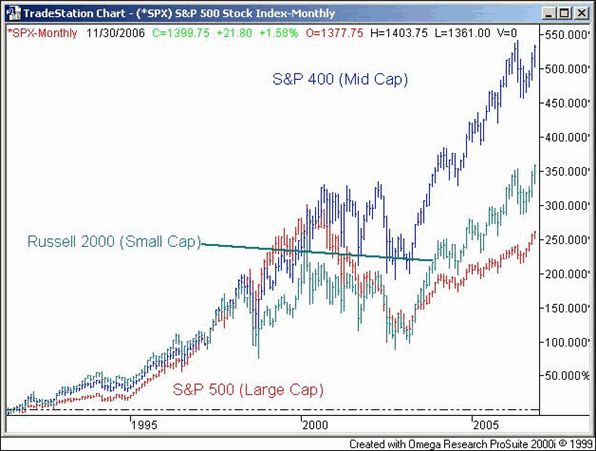
What we're talking about is the difference in performance characteristics of small caps, mid caps, and large caps. Each of them are different, and perhaps more importantly, each of them lead and lag at different times. To really illustrate that point, we've got a special chart for you today displaying the long-term ebb and flow of each compared to the others. Instead of over-laying a few charts on top of each other, we've opted to plot the percentage change of the S&P 500 large cap index, the S&P 400 mid cap index, and the Russell 2000 small cap index. This percentage change chart allows us to make a real apple- to-apples comparison. I think you'll find it interesting.
The chart is pretty straight-forward actually. Rather than plot the actual index levels - which can skew charts - I've plotted the percentage changes for all of the above-mentioned indices going back to mid-1991. To make sure it's perfectly relative, they all essentially started at zero.
The S&P 500 large cap index is in red, the S&P 400 mid cap index is in blue, and the Russell 2000 small cap index is in green. A couple of the chart's nuances were surprising at first, but after some thought, it all made sense.
For instance, it's been said that small caps lead the market over the long-haul. In general, I agree, but a look at the chart clearly shows that mid caps have paved the way. While I still feel strongly about small caps being the best long-term opportunity, this chart should force all of us to really re-think how we define small cap and mid cap. The other factor (and one even tougher to internally process) is the notion that strong small caps become mid caps, and strong mid caps become large caps. So, although the philosophical framework is still in place, how we all choose to apply it may need some tweaking. The traditional view may not be optimal.
The other thing that struck me was the rotational pressures evident over the last 15 years. At one point, each of these three indices led, lagged, and was in the middle. So, there's clearly not a "one cap fits all" approach that works forever -- at least not for your longer-term core positions.
Percentage Performance of S&P 500, S&P 400, Russell 2000 - Monthly

It looks like large caps are set to come from behind and take the lead for a while. The Russell 2000 small cap stocks may also be due for a decent run, while I have to wonder if the mid caps are a little overdue for a break.
All that being said, buying and holding core market cap positions still may not be the best way to maximize your return. In general, here are observations I've made about "trading" each market cap.
Large Cap: Don't assume these stocks can't pack a big performance punch. They may not offer as many mega-winners, but I've seen plenty of instances where traders got out too early, thinking big companies can't put up triple-digit returns. The downside to large companies is that - being well followed by the market (including amateurs) - news can really drive things in the short run. But, these names can also be painfully erratic if the market doesn't know how it feels about a certain stock.
Small Cap: Obviously more speculative, these names offer major returns. However, although they generally do better on the whole, it seems to me as if small companies are likely to go nowhere. So how does this group collectively beat the rest of the market over the long-haul? Because the few winners in this group are usually very big winners. So, if you're playing in this arena, I say you should be extremely picky. One thing I've observed here is that it can take several false starts for a small cap stock to really get moving.
Mid Cap: They're not just in the middle in terms of market cap; the "trade" characteristics are somewhere in between as well. Truthfully, I think this may be the sweet spot for investors, but probably not for traders. The tough part is you seem to have all the volatility of small caps. Yet, the upside is the names are still relatively low key, and not as apt to be pushed around by the media.
Anyway, there's just some food for thought as we approach mild trade in front of the holiday.
Price Headley is the founder and chief analyst of BigTrends.com.