As of volume and volatility weren't going to be limited enough around the Thanksgiving holiday, even for the time the exchanges were open, trading was ultra-limited. As such, there's really not much to discuss regarding last week. We'll take the opportunity instead to focus on the key support and resistance levels for each index. We'll even through in a couple of longer-term looks as well, since we have the time and space.
NASDAQ Commentary
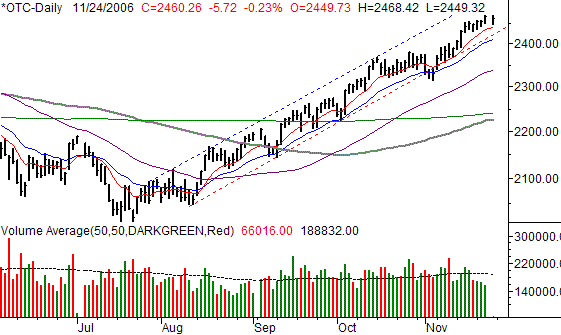
The NASDAQ Composite lost 5.72 points on Friday (-0.23%) to end the shortened week at 2460.26. But on a weekly basis, the index still managed to gain 14.4 points (+0.59%), hitting a new high for the year in the process. It's the same story we've been telling since August, and as it stands right now, it looks to be the same story we're going to tell indefinitely, as long as support holds up.
On our weekly chart, the key thing we're looking at is the bullish channel lines; the support line (red, dashed) is currently at 2426, while the resistance line (blue, dashed) is at 2515. Both are rising pretty sharply. The support line is augmented by similar support from the 10-day and 20-day moving average lines (red and blue, respectively). Despite the odds, as long as any of those support lines hold, we have to side with the uptrend.
The vulnerability is simply the degree to which we're overbought. The NASDAQ Composite is now 9.8% above the 200-day line (green), a condition that's a rarity, and one that usually leads to a pullback of some sort - or at least a consolidation. We think the worst-case-scenario would be a dip back to the 200-day average, currently at 2240. However, the index wouldn't necessarily have to fall that far to make a decisive bottom.
NASDAQ Chart - Daily

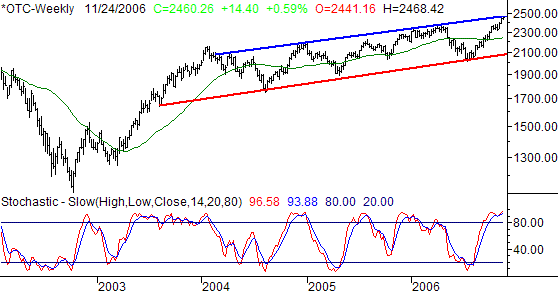
On the weekly chart below, the reason for our bearish concern becomes more obvious. The NASDAQ is now making its fourth node for a long-term resistance line (blue). It's at 2460 - right where the composite closed on Friday. So from a long-term perspective, we truly are at a make-or-break point. With the index being stochastically overbought as it is, we have to be very suspicious of a break. The 200-day average (green) is right in the middle of this longer-term range.
NASDAQ Chart - Weekly

S&P 500 Commentary
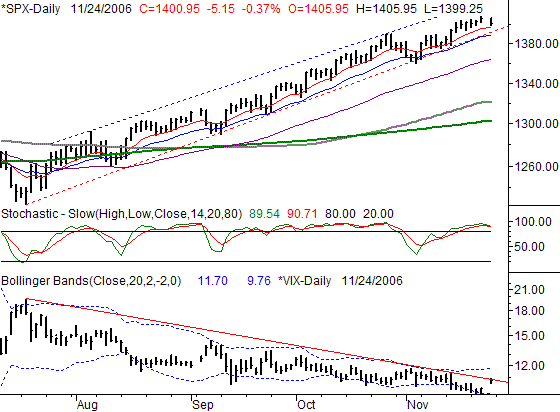
The S&P 500 pulled back by 5.15 points (-0.37%) on Friday to close out at 1400.95 for the week. That was basically even with the prior Friday's close of 1401.20 -- 0.25 points (-0.02%) actually. But like the NASDAQ, the S&P 500 has established a bullish channel that - as long as the support side holds - has to keep us in the bullish camp
The support line (red, dashed) is at 1393, in between the 10-day average (red) and the 20-day average (blue). And all of those have support characteristics - especially of late. As long as the lower channel line isn't breached, the trend will remain intact.
The bearish pressures here will come from an overbought market. We actually became stochastically overbought on the 17th, but over the last week, we saw a red flag within the stochastic lines. In short, they rolled over when the lead line (green) crossed under the lag line (red). That's a pre-curser to a full-blown stochastic sell signal, where both of those lines fall back under the 80 overbought threshold. We're obviously not there yet, but this would be the first step. Of course, even if we get such a sell signal, we'd still need to see the SPX's own support lines break.
The other challenge here is the S&P 500 being 7.4% above the 200-day line (green), a statistical oddity.
As for the VIX, we saw a sharp bounce on Friday that could end up being the beginning of a bigger move higher (which would be bearish for the market). However, it was a very abnormal session on Friday - light, and short. We really need to see what the VIX does on Monday and Tuesday before reading too much into the VIX chart. But, we do want to point out that the VIX's rally pushed it up and into the last potential resistance line. That line would need to stay broken to really say the market's uptrend had finally been halted.
S&P 500 Chart - Daily

On the weekly chart, we can see a mixed blessing of sorts. The S&P 500 has broken well past its previous resistance line (blue). It's technically a breakout, which is good for the bulls. But the question is, how long can the rally continue? We're overbought here too - a technical condition that doesn't persist very long on long-term charts. As for holding long/bullish trades, the trend remains in your favor, even if we see a small dip in the short run. The year-end bullishness is also in your favor.
In terms of adding short/bearish trades and exiting long ones, it may be wise to wait for the index to fall all the way back under that resistance line at 1375. If that happens, the downside momentum is likely to be strong enough to carry the index all the way back down to the lower edge of the range. We shall see.
S&P 500 Chart - Weekly

Price Headley is the founder and chief analyst of BigTrends.com.