Energy
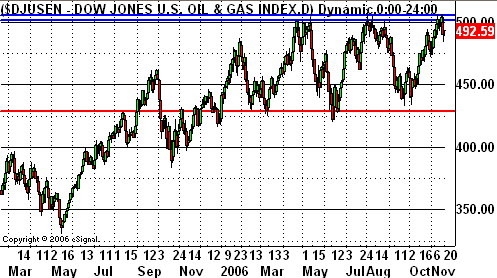
Could we be seeing a triple-top in the works? If you're using the Dow Jones U.S. Energy Index (DJUSEN) as your proxy, you could certainly make that argument. The chart hit 506 last week (twice, actually) before sinking back down to close at 493.85 on Friday. The sellers were back at it on Monday, which has to make us wonder of the third revisit to resistance at the 504/508 range was the last proverbial straw. This is the first time in a long time we've seen the energy sector fail to make a higher high, and now we've seen it happen twice. The stop on the bearish bias would obviously come with any close above 508. The downside target is going to be 430, close to where we've seen this index make a few short-term bottoms of late.
Some of the big names in this index are Encana (ECA), Devon (DVN), Exxon-Mobil (XOM), BP (BP), and Valero (VLO). Keep in mind, however, that this take is based on the entire energy sector. Different industries within the sector may buck the overall trend.
Dow Jones U.S. Energy Index (DJUSEN) - Daily

Tires
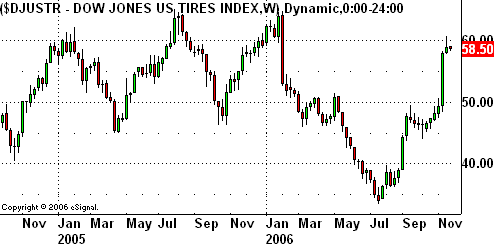
Although obscure to the bone, the Dow Jones Tire index (DJUSTR) has set up what could be an interesting trading idea. Surprisingly volatile, the chart shows a 19.8% move over a span of just five days within the last couple of weeks. By most measures it seems incredible, but a quick glance of this chart's history verifies that moves of that size - perhaps over a slightly longer time frame - are nothing out of the ordinary. In fact, a violent zig-zag environment is quite the norm. With that in mind, we can't help but think this index is due for a pullback in the aftermath of its over-extension. However, approaching the idea may require some fancy footwork. We would only expect to see any downside movement if enough damage could be inflicted on the current chart. We think a move under Friday's low of 57.77 would be enough to jump start some heavy profit-taking. if it happens, then our target would be a move back to 50.50. There's obviously no need to apply a stop if 57.77 is never hit, but if we do start to get a tumble, out stop on the bias would be any close above 59.77.
Key stocks that make up this index include Goodyear (GT) and Cooper (CT).
Dow Jones Tire index (DJUSTR) - Weekly

Water
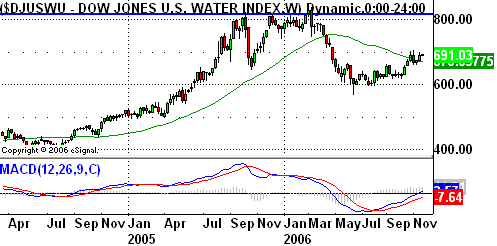
If tires are obscure, then water is entirely off the radar. But, we still like the potential of the Dow Jones Water Index (DJUSWU) chart. Although these stocks got hammered in early 2006, we're starting to see what we feel is a very viable (and potentially big) recovery move. Still choppy on a day-to-day basis, on the weekly chart, the new uptrend is pretty obvious. We have a mature MACD crossover in place that could possibly lead the index all the way back up to above 800. We'll set a target of 810 for the water index, but just keep in mind this outlook is a little lengthy in nature. As for a stop, we'd use the 200 day line (green) at 670 to start.
The bigger water companies are names like Aqua America (WTR), American States Water (AWR), and SJW (SJW).
Dow Jones Water Index (DJUSWU) - Weekly

Price Headley is the founder and chief analyst of BigTrends.com.