All of the equity indices registered strong trend days yesterday as the selling that emerged from the outset continued steadily throughout the session leaving most indices with a close that was very near the lows for the session. One of the remarkable features of trend days, from a statistical point of view, is their tendency to close near to the extreme boundary corresponding to the prevailing direction for the session. We have analysed this closing bias phenomenon in our forthcoming book "Long/Short Market Dynamics" which will be published early in the New Year as part of the Wiley Trading Series.
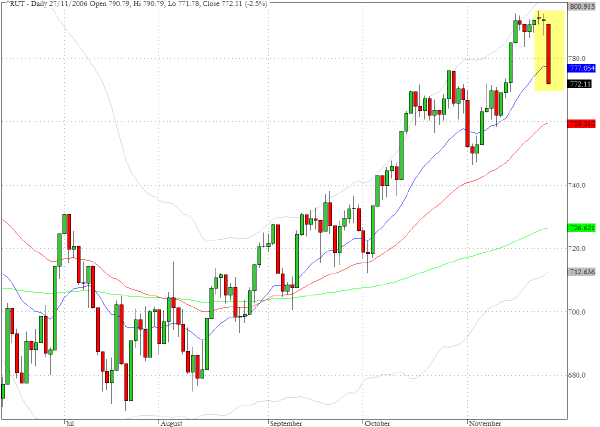
The Russell 2000 was one of the main casualties yesterday and it closed down 2.5% and noticeably below the 20-day EMA. The Nasdaq Composite (^IXIC) was close behind with a 2.2% decline but this index managed to close in close proximity to the 20-day EMA. With plenty of market data to digest this week the volatility genie appears to be out of the bottle and we would expect to see whipsaw sessions in coming days and would not rule out a test of the 50-day EMA's on some indices before the week is done.
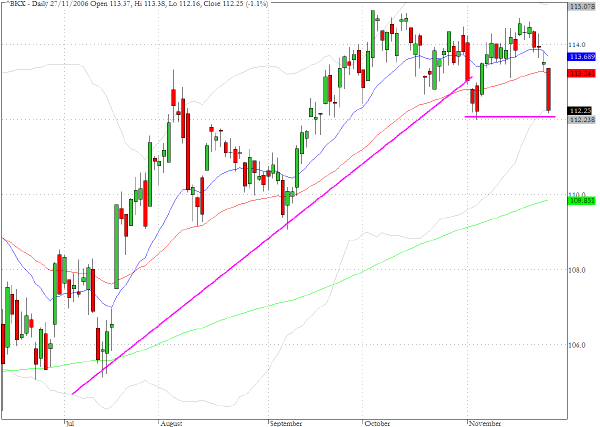
The banking index (^BKX) looks somewhat precarious following yesterday's sell off. Early in November the index violated the upward trendline that had been in place since the summer lows although with yesterday's close it still appears to have found support at these same lows from earlier in the month. Continued erosion in the index would indicate a significant change in sentiment that will unsettle other sectors of the market.
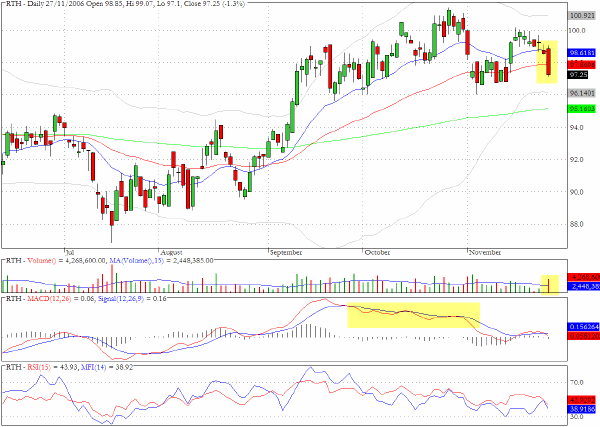
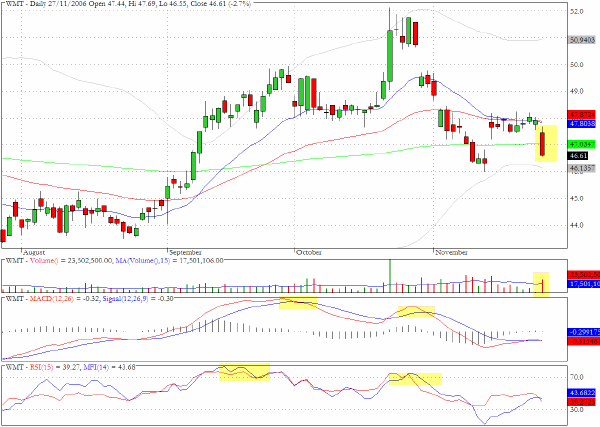
One of the alleged factors behind yesterday’s sell-off was the poor sales data from Wal-Mart. There are cross currents within the retail sector with some outlets reporting better than expected traffic as we head towards the critical Christmas period. The sector fund RTH has been showing divergences for some time as we have commented here recently, and yesterday’s close placed it below the 20- and 50-day EMA’s.
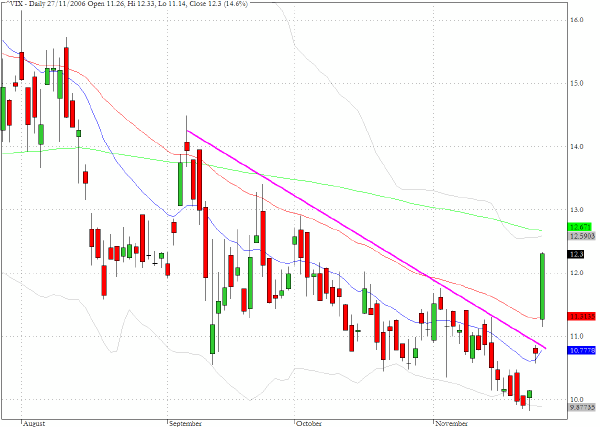
The CBOE Volatility index (^VIX) was jolted out of its recent inertia yesterday with a spike above 12%. Although the declining trendline through the highs since the May/June turbulence was clearly broken yesterday, what has been surprising is how quickly the equity market has been able to regain its composure and return to historically low levels of implied volatility. This is another topic that is examined in some depth in the forthcoming book.
TRADE OPPORTUNITIES/SETUPS FOR TUESDAY NOVEMBER 28, 2006
The patterns identified below should be considered as indicative of eventual price direction in forthcoming trading sessions. None of these setups should be seen as specifically opportune for the current trading session.
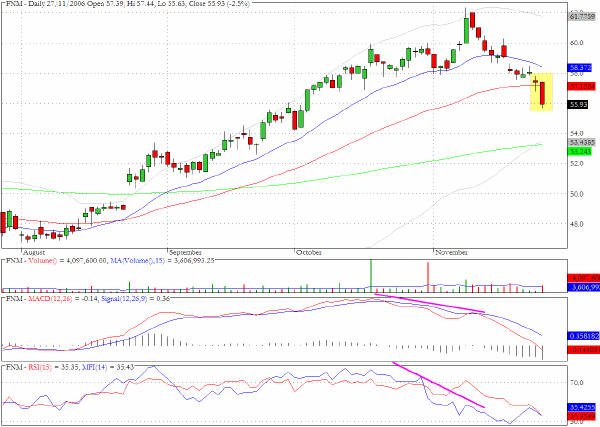
Many stocks broke below their 50-day EMA's yesterday and have charts that reveal the growing negative divergences that have been emerging beneath the surface while the broad market enjoyed its pre-Thanksgiving rally. Fannie Mae (FNM) defied gravity through the early part of November but is now struggling as it moved below the 50-day EMA.
The chart for WalMart (WMT) is replete with evidence of dissonance and the close below the 200-day EMA indicates a failure of the whole September/October rally effort.
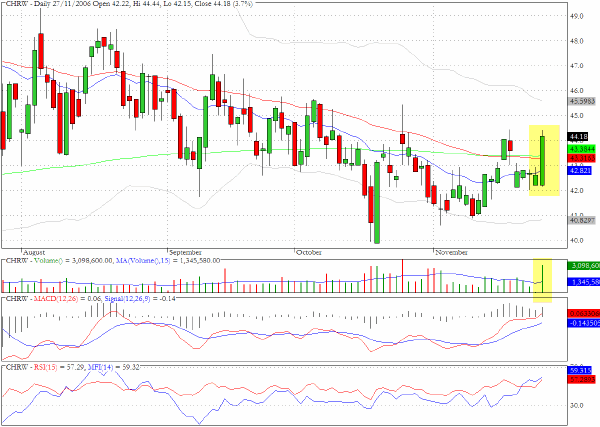
CHRW has one of the most bullish looking charts in the context of yesterday's sell-off.
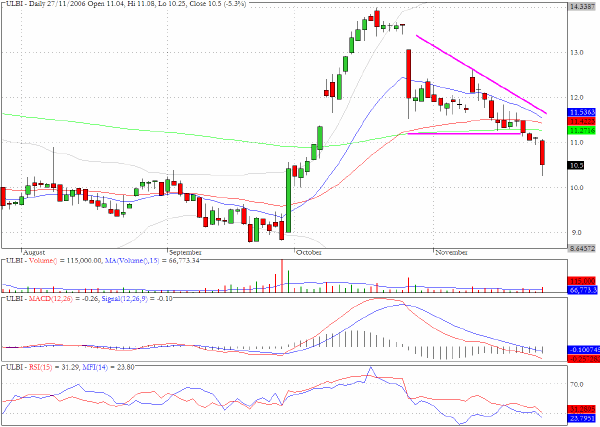
We noted recently that Ultra Life Batteries (ULBI) had traced out a descending wedge formation just above the 200-day EMA and the pattern suggested that there may be renewed selling following the long red candlestick from late October. The more than five percent decline yesterday highlights how this pattern is one of the more reliable for short signals.
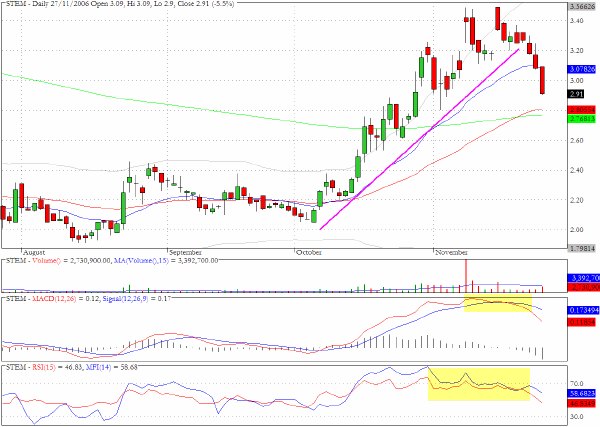
Stem Cells (STEM) succumbed to downward pressure in the light of its negative chart pattern and appears to be headed toward the intersection of the 50- and 200-day EMA's in an attempt to find support.
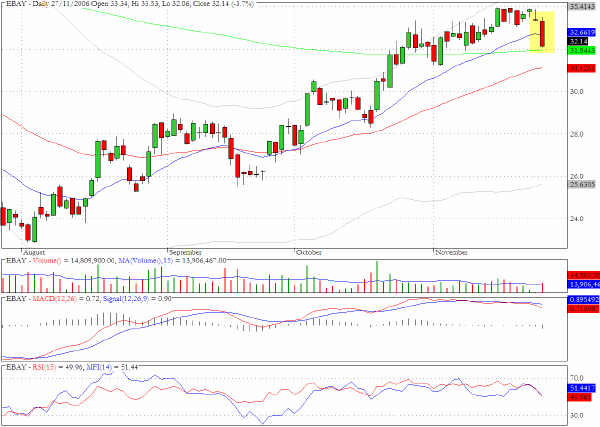
EBAY yesterday retraced the progress it had made during November as it tried to break above the attractor of the 200-day EMA. Assuming the broad market is not on the verge of rolling over we think that the dynamics behind the recent upward progress is not yet spent.
Clive Corcoran is the publisher of TradeWithForm.com, which provides daily analysis and commentary on the US stock market. He specializes in market neutral investing and and is currently working on a book about the benefits of trading with long/short strategies, which is scheduled for publication later this year.
Disclaimer
The purpose of this article is to offer you the chance to review the trading methodology, risk reduction strategies and portfolio construction techniques described at tradewithform.com. There is no guarantee that the trading strategies advocated will be profitable. Moreover, there is a risk that following these strategies will lead to loss of capital. Past results are no guarante of future results. Trading stocks and CFD's can yield large rewards, but also has large potential risks. Trading with leverage can be especially risky. You should be fully aware of the risks of trading in the capital markets. You are strongly advised not to trade with capital.