Well, we'd be kidding ourselves if we said things weren't interesting right now. What appeared to be a non-stop rally finally took a major blow yesterday, which prompts us to ask the question of whether or not this is the end of the road (it's not yet, technically). In the meantime, the U.S. dollar is getting destroyed, and the bond market seems absolutely certain the Fed's setting up a rate cut sometime in the foreseeable future. Simultaneously, crude oil prices as well as bond yields seem stuck in neutral. The former is allegedly good for stocks, since those crude futures are stuck at a relatively low reading. Treasury yields are also stuck though - the 10-year yield has been just a hair under 4.6%, effectively since the end of October.
And the point? There are just a lot of quirks that may put some serious pressure on the market. One of them is the falling dollar. Cheap dollars have the potential to generate inflationary pressures, although gold and oil don't show that just yet. But hang on a second. Inflation will cause the Fed to forego any rate decreases, right? Probably. But wait another minute. Can't inflation stifle the uptrend? Yep, a vulnerability exaggerated by a market that's already overbought. Yet, despite Monday as well as all of this, the technical uptrend is still intact. Today, we'll at least start the process of sorting it all out.
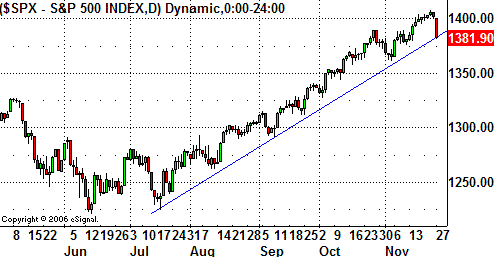
First things first. Despite the S&P 500's 1.36% dip on Monday, the multi-week uptrend is still intact -- barely. Take a look at the chart below. The support line (blue) that goes all the way back to July has no more wiggle room to give up. It will be at 1386 today, which means today really could be a make-or-break day.
What to watch for: Any close under that support line is a bearish concern. Any two consecutively lower closes under it is confirmation of a substantial market correction.
S&P 500 - Daily
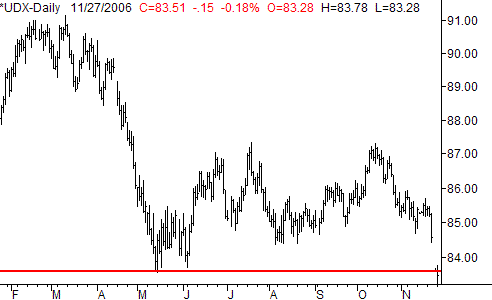
What happened to the U.S. dollar? It wasn't pretty. The U.S. Dollar Index plunged to 52-week lows on Friday, and did not recover on Monday. However, it's not as if this is a new problem for the sawbuck. It's been struggling for a while now. This could ultimately mean inflation will pop its head up again, as it makes dollar-denominated commodities like oil and gold more expensive (more on this below).
What to watch for: Persistence of this condition. If the dollar can't recover, inflation becomes more likely (although it can be good for U.S. companies with heavy exports).
U.S. Dollar Index - Daily
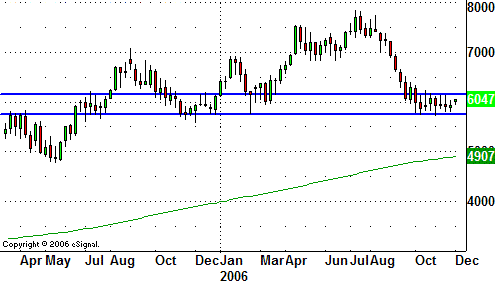
Would you believe crude oil is close to a new 52-week low? That's something we haven't been able to say in a long time. However, oil prices also seem range-bound right now, between 57.60 and 61.40. That support at 57.60 isn't new. We saw support around there in November of last year and February of this year. While we've been waffling here since mid-October, by the virtue of not sinking any lower, we have to think oil is gearing up for at least a small rebound (of course we reserve the right to be wrong).
What to watch for: This chart may really tell the whole story. Energy stocks and the rest of the market have been doing a pretty good job of running counter to each other. If crude can break past 61.40 at the same time stocks break under their support, that may be all the excuse traders need to take profits on equities and migrate into commodities.
Crude Oil Futires - Weekly
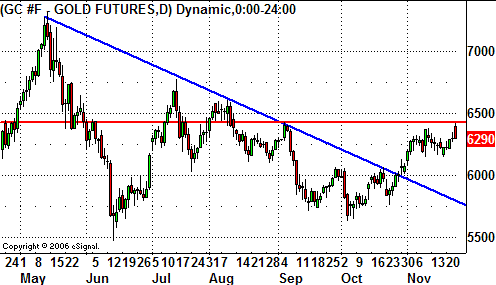
Where oil might be a good counter-indication of the market's momentum, gold is probably a better gauge of inflation. Of course, it can still weigh in on stocks. And what's gold saying right now? Well, it's moving higher, and has been for a while despite all the certainty that inflation has been contained - and that the Fed is going to cut rates. A key intermediate-term resistance line (blue) has been broken, confirming the strength of the buying effort. Obviously one camp or the other has to be wrong. Adding to that upside possibility is what may end up being an upside-down head-and-shoulders pattern.
What to watch for: A close above resistance at 642.50 could pretty much clinch a bullish breakout, and passively confirm that traders see inflation. The gold bulls aren't wrong very often.
Gold Futures - Daily
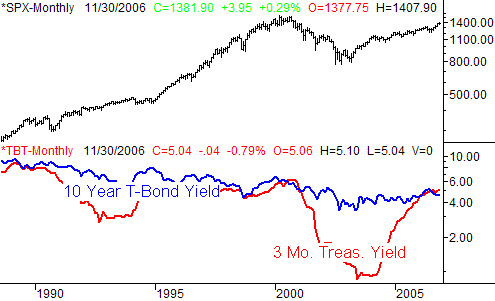
We first mentioned the notion of a rate cut (or series of them) a couple of weeks ago. All we can say is if it's going to happen, the Fed better take care of t sooner than later. The yield curve has been inverted since August. On our yield curve chart, the 3-month treasury yield (red) is a hair over 5.0%, while the 10-year note yield (blue) is right around 4.5%. This is quite an illustration of where many traders are saying one thing but doing another.
What to watch for: This needs to get fixed soon if this alleged cyclical bull market is going to have any shot at surviving. In some ways, this is almost going to force the Fed to attack the problem by lowering rates.
Yield Curve - Monthly
OK, that's obviously not all the detail we could provide, but it's a pretty complete overview of the forces at work right now. The key problem is just how the Fed may have to choose what they think is the lesser of two evils. If they raise rates the yield curve could become even more inverted, leading the market to an implosion. If they lower rates, inflation could really start to swell - led by oil and gold, which may be spurred by a weak dollar. The problem is, a weak dollar may be the result of lower-than-usual interest rates (talk about a catch-22!). Neither of these scenarios is particularly bullish. However, we do think traders could find some excellent opportunities in the midst of all these charts. And, for what it's worth, we haven't counted the bulls out yet. If all of these charts turn-around soon, we're not going to be afraid to get bullish.
Price Headley is the founder and chief analyst of BigTrends.com.