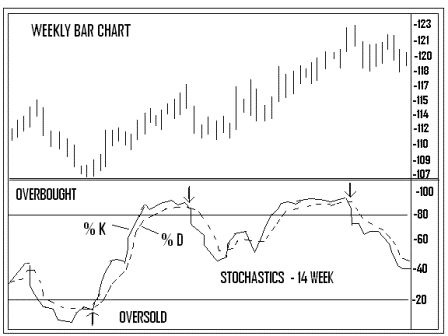
Popularized by George Lane, president of Investment Educators, Inc. of Watseka, IL, the Stochastic oscillator is based on the observation that as prices increase, closing prices tend to be closer to the upper end of the price range. On the other hand, in downtrends, the closing price tends to be near the lower end of the range. There are two lines used in the Stochastic Process – the %K and the %D lines. Of the two lines, the %D is the most important and is the one that provides the major signals.
The objective is to identify where the most recent closing price stands in relation to the price range for a specific period of time. The most common time period is 14. It can be 14 days, weeks, or months. The K line, which is the more sensitive of the two, can be figured by using this formula:
%K = 100 [(C-L14) / (H14 – L14)]
where C is the latest close, L14 is the lowest low for the last 14 periods, and H14 is the highest high for the same 14 periods.
The formula measures where the closing price is in relation to the total price range for a selected time period on a percentage basis of 0 to 100. A very high reading, one which is above 80, puts the closing price near the top of the range. A low reading, under 20, puts the closing price near the bottom of the range.
The second or %D line is a 3 period moving average of the %K line, and this application produces a version referred to as fast stochastics. By taking another 3 period average of %D, a smoother version called slow stochastics is produced. Most traders use the slow stochastics because the signals are more reliable.
These formulas produce the K & D lines that oscillate between a vertical scale of 0 to 100 where the K line is the faster line, and the D is the slower line. It was mentioned that the D line is the most important. The reason…the major signal to watch for is a divergence between the D line and the price of the underlying market when the D line is in an overbought (over 80) and oversold (under 20) area.
When the D line is over 80 and forms two declining peaks while prices continue to move higher, it is considered a bearish divergence. The bullish divergence occurs when the D line is under 20 and forms two rising bottoms with prices continuing to move lower. When these factors are in place, the buy or sell signal takes place when the faster K line crosses the slower D line.
Despite the higher level of sophistication in Stochastics, the basic oscillator interpretation is the same. An alert or set-up happens when the %D line is in an extreme area and diverging from the price action, with the trade signal taking place when the D line is crossed by the K line.
Stock traders and Option traders can use this oscillator on weekly or monthly charts for their longer range trades, but Day traders can also use it effectively on intraday charts. Daily and weekly stochastics can be used in combination. The weekly signals determine market direction while the daily signals are used for timing. An even better idea is to combine stochastics with the Relative Strength Index (RSI).

The rough graph above shows two down arrows in the overbought area where the faster %K line crossed below the slower %D line creating sell signals, and one up arrow in the oversold area where the K crosses above the D prompting a buy signal.
Andy Swan is co-founder and head trader for DaytradeTeam.com. To get all of Andy's day trading, swing trading, and options trading alerts in real time, subscribe to a one-week, all-inclusive trial membership to DaytradeTeam by clicking here.