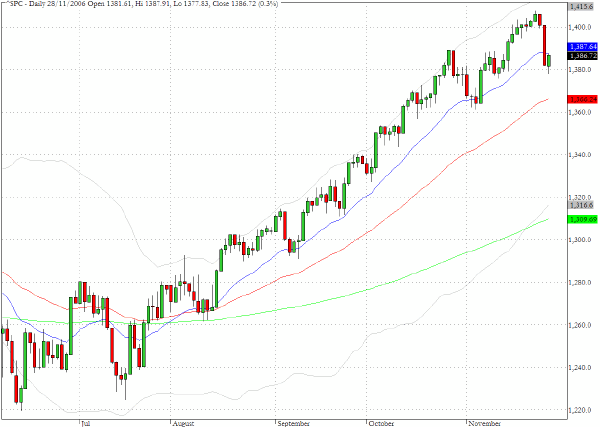
Having retreated to 1381 a level just below the 20-day EMA in Monday's broad sell-off the S&P 500 cash index (^SPC) tested further downside possibilities in early trading yesterday. Other indices performed similar probing below their respective 20-day EMA's and buying appeared in each case to leave hammer candlesticks on the charts.
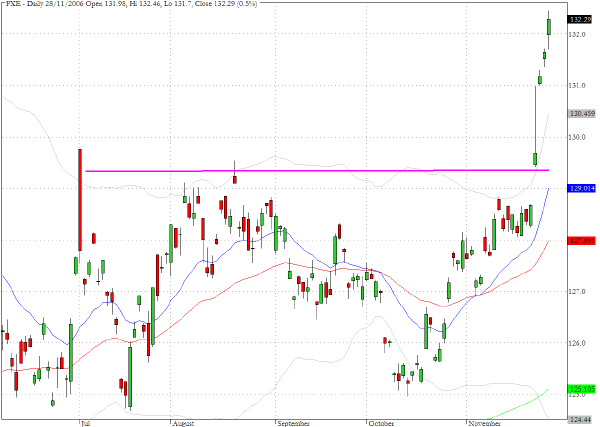
The dollar continued its decline yesterday as the Euro moved up towards $1.33 while the British pound made further gains as it appears headed towards the $2.00 level. When it was last at this level in September 1992, sterling came under a sustained assault which led to the currency being withdrawn from the ERM, the monetary framework which preceded the euro.
Circumstances are very different today and sterling levels are set by the market and not by the UK government but in general many European governments and central bankers are becoming increasingly concerned by the effect that a stronger currency relative the US dollar will have on their exporters, especially in the Asian markets.
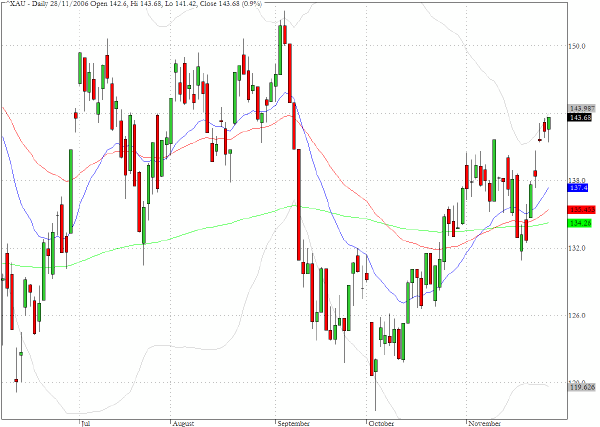
The gold and silver index seems to be bracing for an assault on the August high just above 150. Precious metals prices would seem to be direct beneficiaries as the dollar weakens further
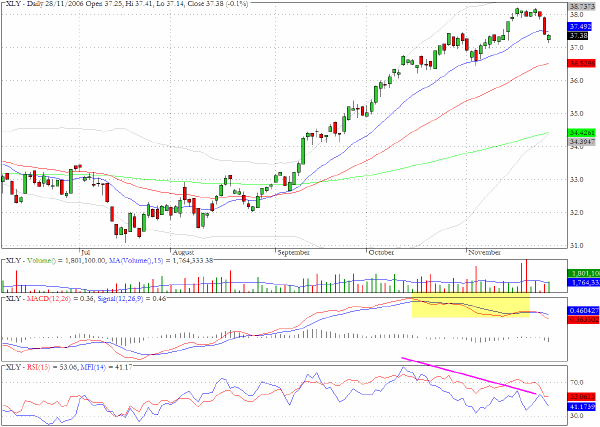
We have drawn attention to the negative divergences that are manifesting themselves in some of the sector funds. As we noted yesterday the retail sector fund, RTH, appears to be struggling and suffered a further decline yesterday and we see similar chart patterns for XLY, the ETF for the consumer discretionary sector.
TRADE OPPORTUNITIES/SETUPS FOR WEDNESDAY NOVEMBER 29, 2006
The patterns identified below should be considered as indicative of eventual price direction in forthcoming trading sessions. None of these setups should be seen as specifically opportune for the current trading session
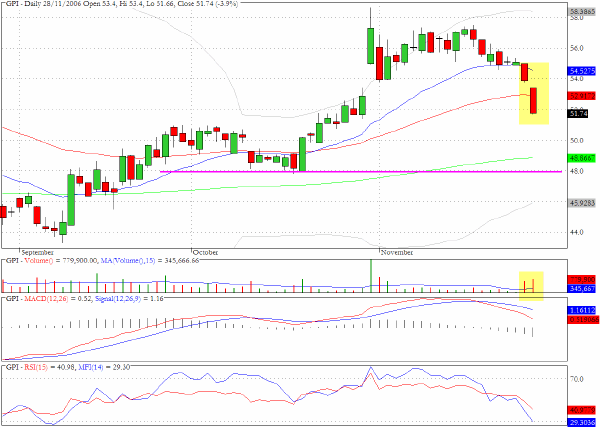
Group 1 (GPI) broke below the 50-day EMA on heavy volume and seems to be headed towards $48.
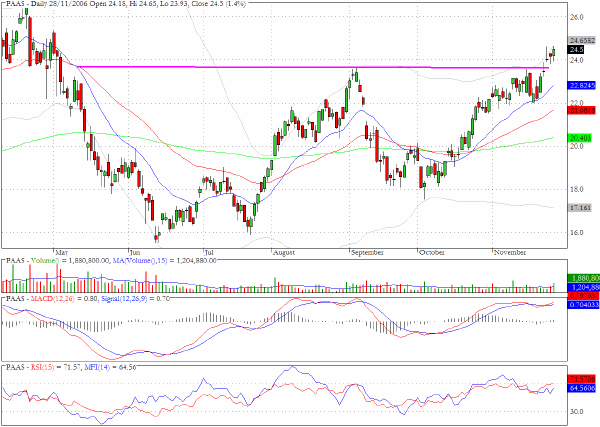
In harmony with the constructive nature of the chart for the gold and silver index (^XAU) that we reviewed above we would monitor PAAS for a possible breakout effort in coming sessions.
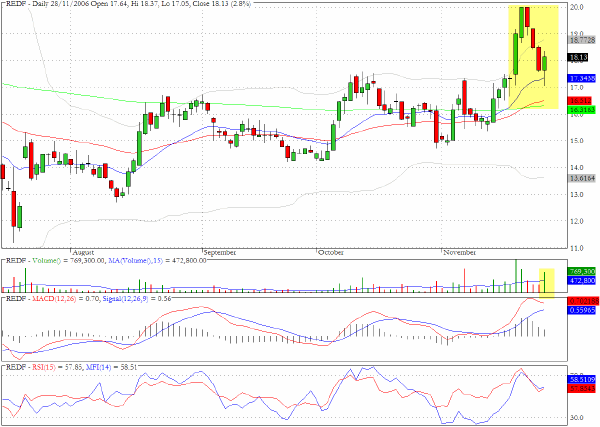
Rediff.com (REDF) registered a well defined hammer candlestick on twice the average daily volume and another attempt to take on the $20 barrier is to be expected.
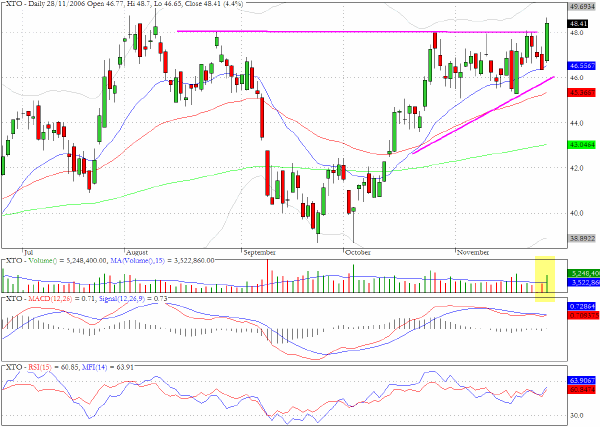
The ascending wedge/cup and handle formation for XTO Energy seems to be pointing towards an imminent breakout.
Clive Corcoran is the publisher of TradeWithForm.com, which provides daily analysis and commentary on the US stock market. He specializes in market neutral investing and and is currently working on a book about the benefits of trading with long/short strategies, which is scheduled for publication later this year.
Disclaimer
The purpose of this article is to offer you the chance to review the trading methodology, risk reduction strategies and portfolio construction techniques described at tradewithform.com. There is no guarantee that the trading strategies advocated will be profitable. Moreover, there is a risk that following these strategies will lead to loss of capital. Past results are no guarante of future results. Trading stocks and CFD's can yield large rewards, but also has large potential risks. Trading with leverage can be especially risky. You should be fully aware of the risks of trading in the capital markets. You are strongly advised not to trade with capital.