NASDAQ Commentary
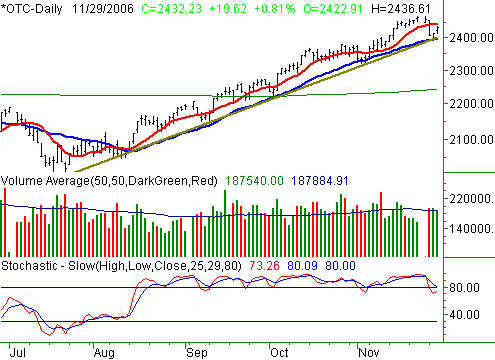
The NASDAQ Composite rallied by 0.81% on Wednesday, gaining 19.62 points to end the session at 2432.23. However, that move still left the index well short of last week's close at 2460.26. We're in the red by 1.14% (-28.03) points, thanks largely to Monday's colossal selloff. So, we don't think the bulls should get too giddy just yet.
We'll at least say this much for the bulls. Their support line has been steadfast. We've switched the color to brown today so it really shows up. As we've been saying since about a month ago, any bearish prediction would ultimately depend on it being breached. Clearly it isn't yet (although we'd be the first to admit a little surprise about that). In fact, it appears to be the rebound point after Monday's dip. Currently at 2401 and rising, this is the line to be watching.
Secondarily, the 20-day moving average line (blue) has also continued to be strong support. It's also at 2401, making that level an even more critical one.
Volume throughout this uptrend has stayed strong too, so it's not as if the rally is tapering off. So, if and when it ends, it's not likely to be just because there's a lack of buyers.
However, the risk still remains. The composite is still well overbought, and well past its 200-day moving average (green) at 2243, 8.4% above it, to be exact. Both will weigh in on this rally. The question is just one of whether or not they'll weigh in enough to snap the trend. If the support finally does fail, we're now looking for a dip all the way back to that 200-day line. However, that's not a prediction - at least not yet. Remember, we're in the most bullish period of the year, and the trend as of right now still remains a bullish one.
NASDAQ Chart

S&P 500 Commentary
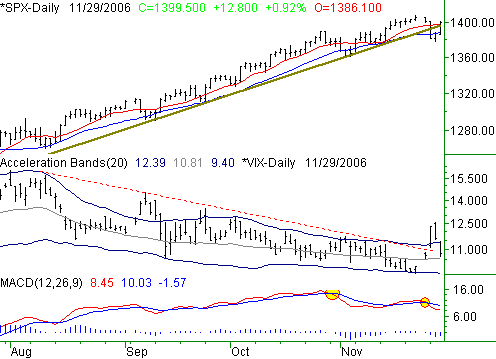
The S&P 500 led the charge on Wednesday, finding 12.8 points to gain 0.92%, and end the sessions at 1399.50. For the week though, this large-cap index is still in the red...but only by 1.45 points (-0.1%). Although we're back to square one, this being the most volatile week we've seen in a while has us wondering if the complexion is changing - despite Wednesday's rebound.
Since we took a mostly-bullish slant with the NASDAQ commentary, we'll be 'fair and balanced' by putting a bearish spin on the S&P 500 chart. (Remember, our only goal here is to point out the significant things we see on the chart, which will hopefully provide the kind of insight to let you come to your own conclusions.)
And what exactly do we see? Although back above it now - thanks to yesterday's run - the SPX's long-term support line (brown) was breached earlier this week. The same goes for the 10- and 20-day lines (red and blue, respectively). It's just worth keeping an eye on - that's all. If you're looking to re-create this line on your own charting software, we're using the lows from 9/11, 9/25, 11/3, and 11/6 as our nodes (not a perfect line, but very close).
What we find fascinating, though, is the disparity between the technical indicators and the index gains. The MACD chart is particularly interesting, in that it has been 'bearish' while stocks have continued to move higher. Both of the MACD sell signals (crossunders) are highlighted on the chart. After the first one, the SPX gained 18 points before the sell signal was negated. The second sell signal is still active, but the index is 17 points above where it was then. For what it's worth, we think the technical indicators usually see things that are not obvious, and perhaps see things that are totally at odds with the obvious. So, smart traders may want to keep a close eye on the MACD lines right now -- one of its sell signals will get traction eventually.
The only other thing worth a mention is the VIX's surge earlier this week, which broke a long-term resistance line. Of course, the VIX moving higher is bearish for stocks. Unless we see the VIX continue to slide back down to its recent 10/11 range rather than continuing to head higher, we think this too could break the will of the bulls (who are pressing their luck to begin with).
To quantify whether or not the VIX is moving higher, we'll be looking for two consecutive closes above the upper band line...the second one higher than the first.
S&P 500 Chart

Dow Jones Industrial Average Commentary
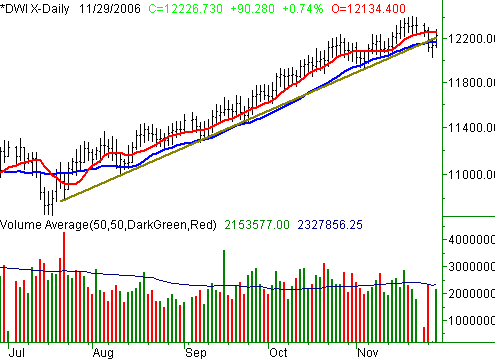
The Dow Jones Industrial Average's 0.74% gain on Wednesday added 90.28 points to its total, leaving the index at 12,226.73 by the end of the trading session. For the week, however, we still find the Dow under water by 53.44 points, or -0.44%. And despite the move back above the 20-day moving average line today, it still doesn't change the fact that the 20-day line failed to act as support on Monday. So, the most recent bout with the sellers wasn't as easily shrugged off as the previous ones have been.
Other than that, the analysis above basically applies here as well. Note the brief dip under the Dow's support line on Monday and Tuesday.
Dow Jones Industrial Average Chart

Price Headley is the founder and chief analyst of BigTrends.com.