A minor corrections of sorts occurred in the last week. Once again, it was a 2-day affair, not lasting long enough to generate sell signals from our technical indicators. So, once again, we continue to view this market bullishly.
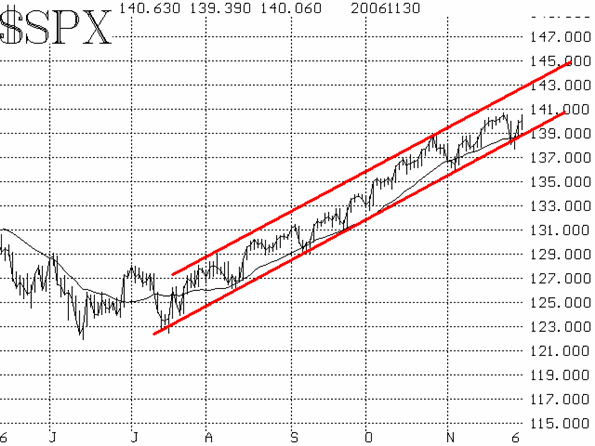
$SPX continues to remain within its uptrending channel. During the correction, it probed down to 1377, near the bottom of that channel, and then rebounded. So, we can safely say that the 1375-1380 area represents support on $SPX. The subsequent rally was aided by month-end window dressing, and most of it occurred on the day before month-end (Wednesday, November 29th, in this case). On the actual month-end, there were fairly heavy sell programs at the close. Those prevented $SPX from making new highs. Hence, one might say there is short-term resistance at 1408, the recent high on $SPX. If the recent past is any guide, though, that will shortly be overcome.

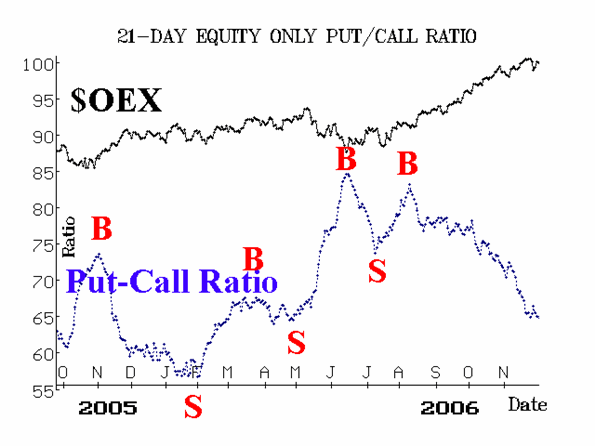
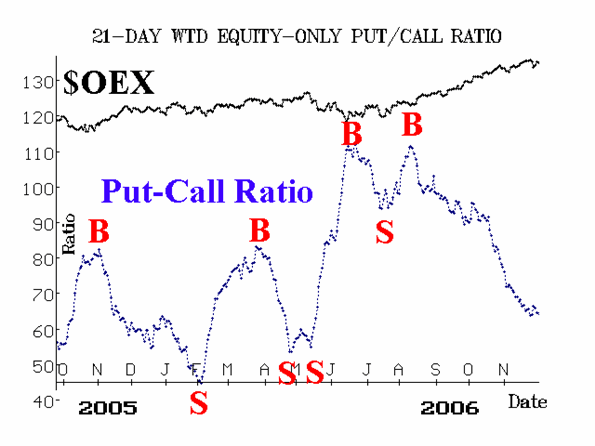
The equity-only put-call ratios continue to remain on buy signals, as they generally are still trending lower. The 2-day correction did force them to "blip" upward, but that has now been overcome as they are making new lows once again -- and that's bullish. These important indicators will remain bullish unless they roll over and begin to trend higher.

Market breadth (advances minus declines) is the only indicator that gave a sell signal during the correction. But, breadth switched camps with a vengeance during Wendesday's strong rally. This leaves the breadth oscillators in overbought territory once again. They would only give sell signals if breadth began to turn negative again.

Finally, the volatility indices ($VIX and $VXO) spiked up briefly -- but rather sharply -- during the correction. In fact, $VIX advanced for 3 consecutive days, which is often the beginning of a sell signal. However, in looking at the chart of $VIX, we would not call it a "sell" unless $VIX closed above 13. That has not yet happened. Since the rally resumed, $VIX fell back towards its lows near 10. Thus, it remains in an overbought state, but the market can rally while $VIX is in that state.

In summary, the market remains in an intermediate-term uptrend, but since breadth and volatility have returned to overbought levels, the possibility of another sharp, but short-lived correction is possible at any time. This is the same opinion that we've held for quite some time.
Lawrence G. McMillan is the author of two best selling books on options, including Options as a Strategic Investment, recognized as essential resources for any serious option trader's library.