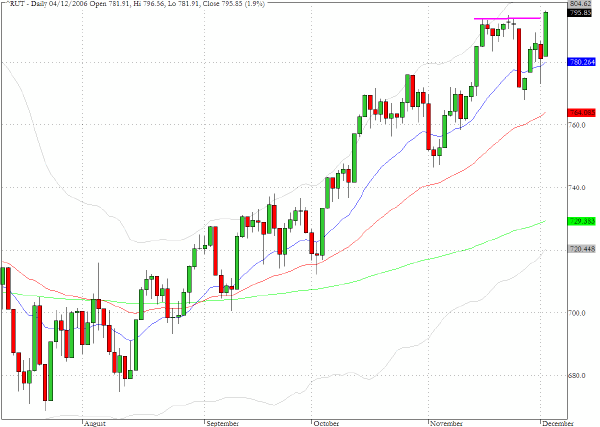
The resilience that was a feature of last Friday afternoon's recovery in the equity indices set the tone for yesterday's follow through to the upside. A new all-time closing high was registered for the Russell 2000 index (^RUT) as it outperformed the other indices with a 1.9% gain. This suggests that, while there may have been much short covering that helped to power the gains in the larger cap indices, there seems to be a healthy appetite amongst the long only portfolio managers to put new money to work.
Volume generally was less than Friday's and registered below the 15-day SMA for both SPY and QQQQ. The S&P 500 cash index also reached a new multi-year high as it closed at 1409 for a 0.9% gain while the Nasdaq 100 (^NDX) closed about 1% below its recent multi-year high.

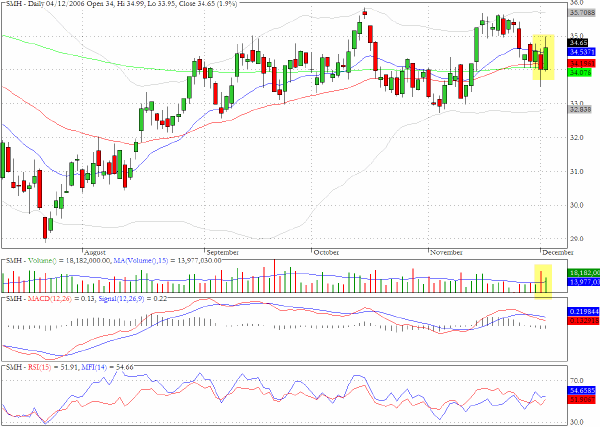
The semiconductor sector as represented by the exchange traded fund SMH found support at the 200-day EMA and moved up 1.9% but again the volume was light and only just managed to achieve 50% of Friday's volume.
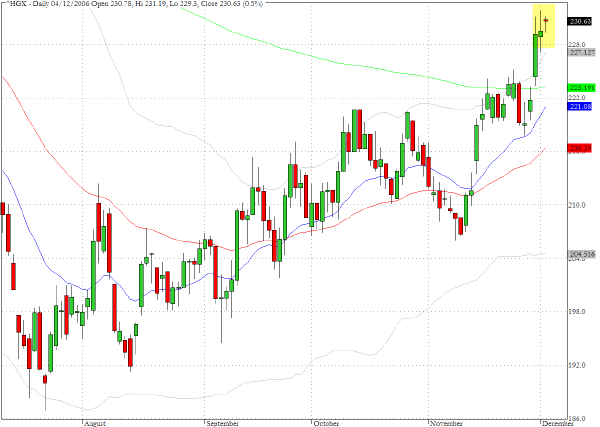
Last week we commented on the apparent breakout by the housing index (^HGX) above the 200-day EMA and suggested that we would be monitoring the index this week for confirmation. Yesterday√Ę‚,¨‚"Ęs tiny Doji candlestick, which was also an inside day and an NR7 formation is intriguing and the validation of the breakout is still pending.
TRADE OPPORTUNITIES/SETUPS FOR TUESDAY DECEMBER 5, 2006
The patterns identified below should be considered as indicative of eventual price direction in forthcoming trading sessions. None of these setups should be seen as specifically opportune for the current trading session.
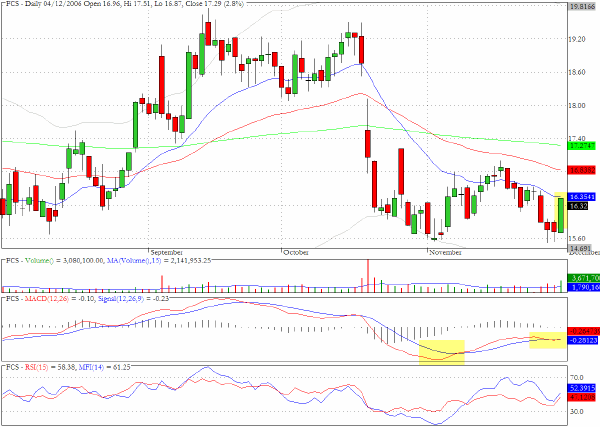
Fairchild Semiconductor (FCS) delivered a 2.8% gain on above average volume and the momentum and money flow suggests that the 200-day EMA about one dollar above yesterday's close will be targeted.
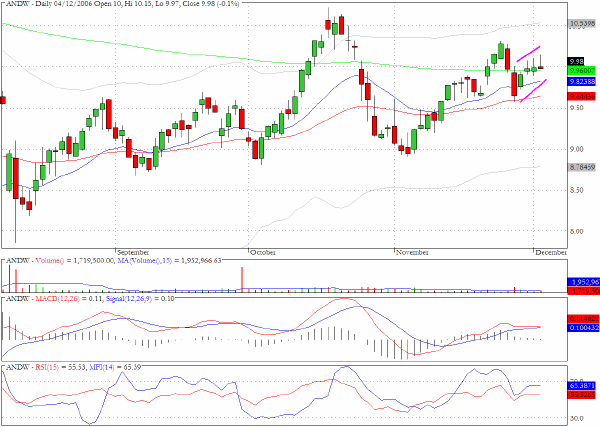
Andrew Corporation (ANDW) has the right characteristics for a bear flag setup and the last three candlesticks have long upper tails as the stock is finding resistance at the $10 level.
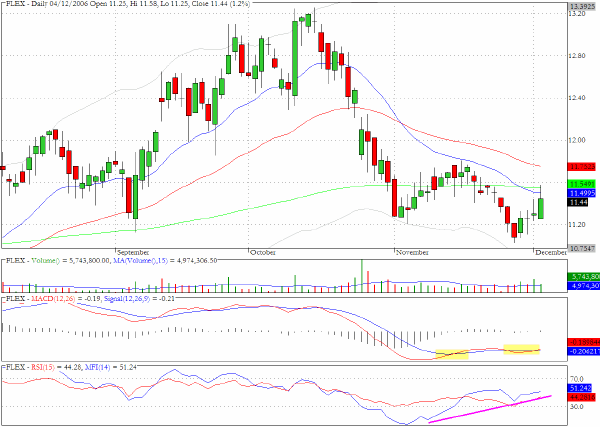
Flextronics (FLEX) has some positive divergences but has to overcome the moving average hurdles ahead.
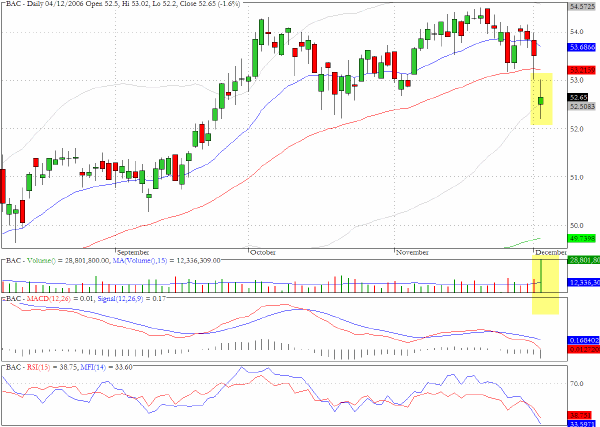
Bank of America (BAC) was a counter-trend casualty in yesterday's trading and gapped lower to close below the 50-day EMA on very heavy volume. The spinning top suggests that some support was found near $52 but it would not be surprising to see further weakness following a probable pullback channel.
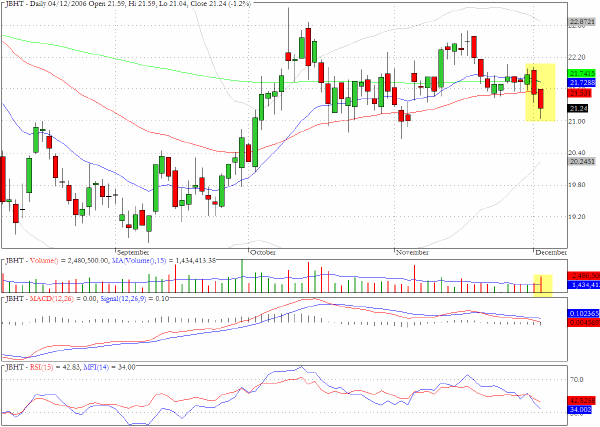
JB Hunt (JBHT) broke loose of its moving averages and closed below all three on heavy volume.

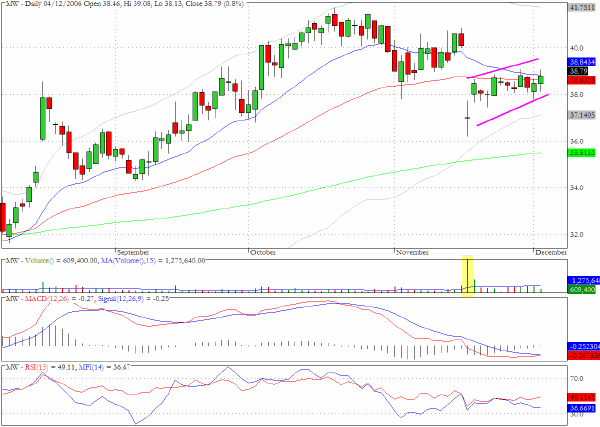
Men's Warehouse (MW) looks vulnerable to further weakness.
Clive Corcoran is the publisher of TradeWithForm.com, which provides daily analysis and commentary on the US stock market. He specializes in market neutral investing and and is currently working on a book about the benefits of trading with long/short strategies, which is scheduled for publication later this year.
Disclaimer
The purpose of this article is to offer you the chance to review the trading methodology, risk reduction strategies and portfolio construction techniques described at tradewithform.com. There is no guarantee that the trading strategies advocated will be profitable. Moreover, there is a risk that following these strategies will lead to loss of capital. Past results are no guarante of future results. Trading stocks and CFD's can yield large rewards, but also has large potential risks. Trading with leverage can be especially risky. You should be fully aware of the risks of trading in the capital markets. You are strongly advised not to trade with capital.