A little over a month ago, we took a look at charts of oil, gold, and the dollar. They were of particular interest at the time, since each of them has an impact on the stock market, and each of them were on the verge of a major bearish break-down or bullish break-out. Well, we now have some note-worthy movement for each of those charts. Today, however, we want to really focus in on the crude chart.
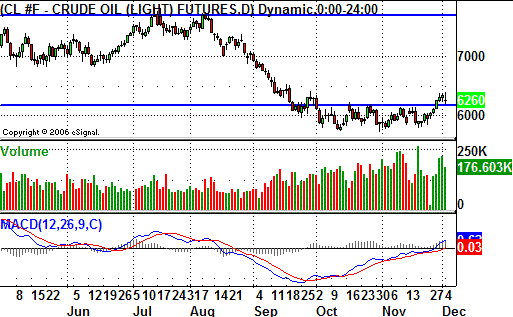
When we first took a look, crude prices were stuck in a range between 57.75 and 61.90. Stuck between those lines for close to a month by that point, we knew a bigger move was likely in the works. As it turns out, the bullish break-out is the move that would be made. As of yesterday, the close at 62.64 is well past that resistance line, yet well under the recent high of 63.82 (also hit yesterday).

So, was last week's oil rally just a bit of bullish volatility, or has the consolidation period set up a short-term recovery? Overall, we tend to think the latter for a handful of reasons.
The volume behind the move has been strong, and as a result we extended the MACD lines (they were already bullish) into the above zero territory - a more subtle bigger picture bullish sign. But that's not the only reason.
According to Hirsch's Stock Trader's Almanac, December also begins a bullish period for oil. Their data indicates that, over the last ten years, oil stocks have gained an average of 16.2% between December and June. The figure improves to a gain of 19.0% when looking at just the last five years.
But oil has been so hot, then cooled off so rapidly in the fall. Can this sector really rejuvenate itself and press upward again? I think so. Had the time between July and November been as bullish for oil as the last couple of years had been, I might be a little less inclined to say that. But, the August/September dip was halted fairly quickly with a flat period in October and November. That consolidation may be have given the bull just enough time to recharge their batteries. And, armed with the seasonal trend, I see the bias being back to the upside again. Take a look at the daily chart here (then we'll look at the weekly chart after that).
Crude Oil Futures - Daily

Plus, digest this perspective -- the average December-to-June gain is about 17%. If crude oil gains 17% more than the current price of 62.58, that would put it right around 73.20. We saw highs above 77 in August, so it wouldn't be unheard of for this seasonal trend to play out again.
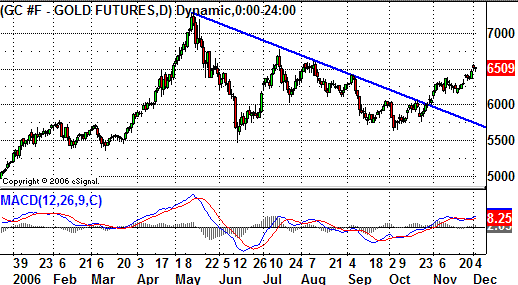
What about gold? Yesterday's close of 650.90 is easily past that resistance line we were eyeing last month. And, it looks like there's some momentum behind the move, perhaps enough to carry things back up towards 700+. Gold has the ability to make major parabolic moves in short periods of time, so even though it feels like a pullback is likely, I'll just refer you back to the March-through-May move from 560 to 711. Just when you thought gold couldn't go any higher, it went even higher. That's not to say it should have, or will again. I've just seen gold make incredible moves that may not have seemed reasonable at the time. Take a look at the daily chart here, then the weekly chart below.
Gold Futures - Daily

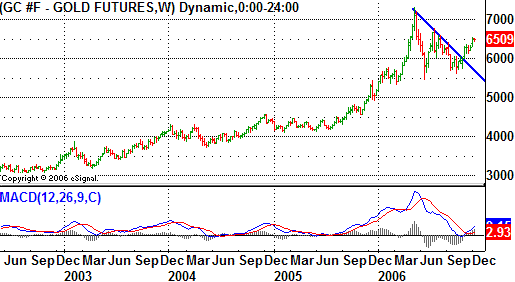
And what could drive gold higher (again) on this weekly chart? In a word, inflation. I know, I know, inflation has been beaten down to sub-2 as of last month. But, that data is a month old, and doesn't factor in the downside reversal the U.S. dollar made over the last several days. See, a weak dollar leads to inflation. The Fed can do some things to fight inflation (like raise rates), but there's not a whole lot they can do about a weak dollar -- at least not much that would be of any benefit. In any case, I think gold is better suited to benefit from inflation, where oil is probably better suited to run counter to the market (although both commodities are capable of doing both). Keep an eye on all three, as a continued rise in gold and oil may mean pressure on stocks.
Gold Futures - Weekly

Price Headley is the founder and chief analyst of BigTrends.com.