NASDAQ COMMENTARY
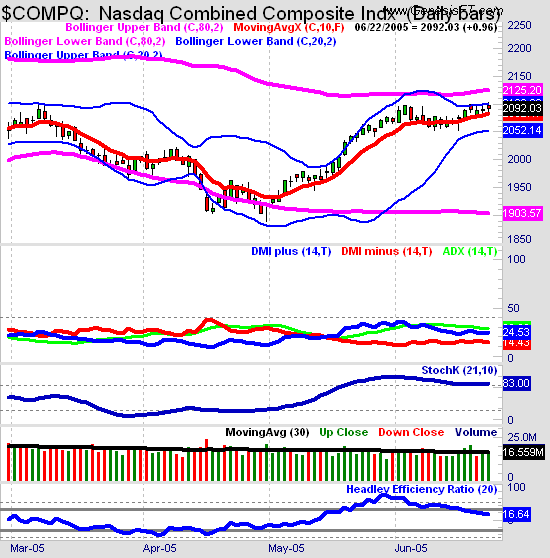
The Nasdaq continues to hover impressively just under the 2100 resistance level. While we're concerned by the upper Bollinger Band (in pink) hovering as long-term resistance at 2125, the technical indicators are still favoring continued upside for the Nasdaq. The Directional Movement lines still show the positive above the negative, the Nasdaq Composite is holding above its 10-day exponential moving average, and Stochastics is holding above the 80 level, which often occurs in the midst of a powerful uptrend. The Efficiency Ratio is coming down to suggest a more choppy market ahead.
The bottom line is that the Nasdaq has been outperfoming the Dow and S&P 500 in the last monht, which is typically a bullish event as it shows that money managers are starting to get more aggressive. We expect the market to move moderately higher into the mid-July earnings season.
NASDAQ CHART - DAILY

S&P 500 COMMENTARY
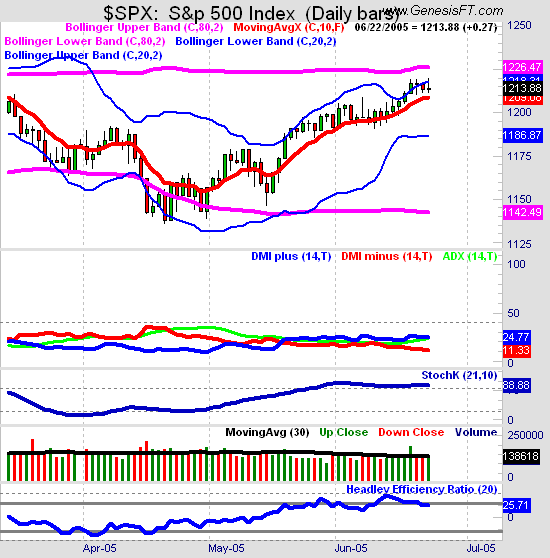
Like the Nasdaq, the technical indicators are more bullishly positioned than bearish. The S&P 500 has retaken the 1200 level and appears posied to move back to the 1250 -1263 zone as the next major resistance. The 1226 level looks like the major resistance while support is down at 1187 first, followed by 1150 and 1142. The 10-day exponential moving average (in red) has held the S&P 500 pullbacks in check beautifully during the last six weeks, so watch the 1209 level closely on a closing basis.
S&P 500 CHART

Price Headley is the founder and chief analyst of BigTrends.com.