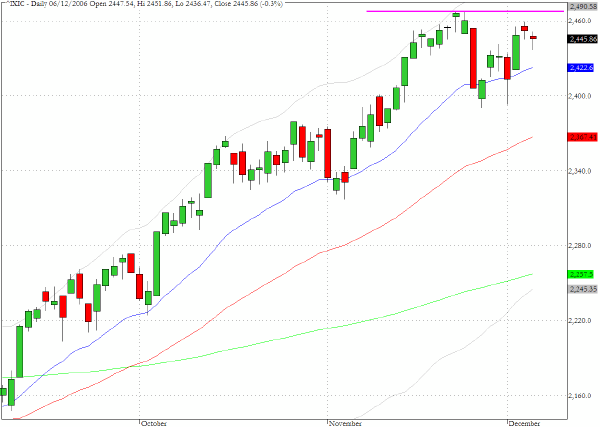
The chart formation for the Nasdaq Composite (^IXIC) became more intriguing yesterday as the index pulled back 0.3% and another tiny body Doji was formed. If one was to combine the last two sessions in one candlestick there would be a very striking spinning top pattern which, occurring in the context of the proximity to the recent multi-year high, suggests that traders are in a hesitant mode waiting for a clear sense of direction.
Perhaps the employment data will clarify the market's intentions, but one of the features that we are monitoring is the technical deterioration that is taking place in some large cap, widely owned stocks such as GE, AMGN, INTC, ADBE and Ford among others.

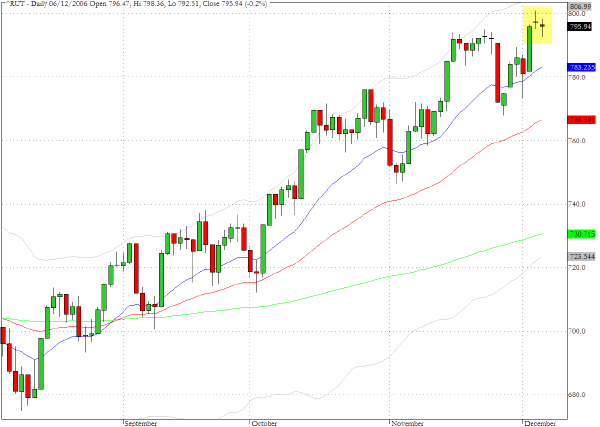
The pattern in the Russell 2000 index (^RUT) closely resembles the recent Nasdaq chart pattern that we just examined but the hesitation comes as the small cap index reached an all time high on Tuesday. The reward/risk ratio for being long in the stocks in this index is becoming less favorable and, should we see an abrupt dislocation, IWM would be the index proxy that we would like to be short with a matching long position in the SPY proxy.
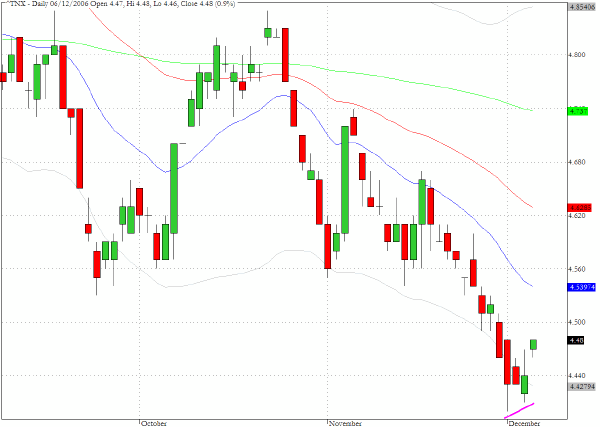
The yield on the ten year not appears to have registered a short term base in the last few sessions. Looking back historically the 4.4% yield has been a pivotal chart level and, as always, one of the indicators that we will be looking at keenly in Friday√Ę‚,¨‚"Ęs trading is the reaction of Treasury traders to the employment data.
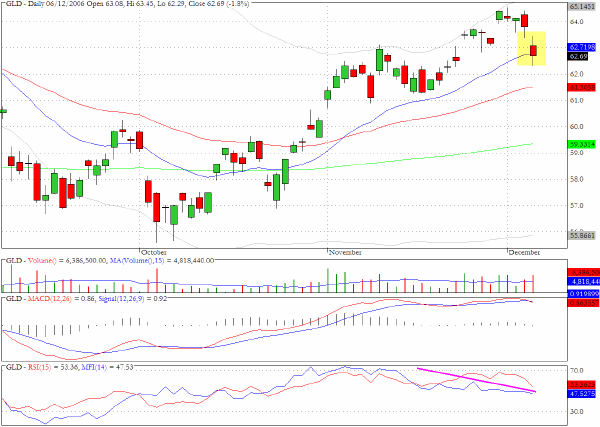
The price of gold has encountered strong resistance and, as the chart for the exchange traded instrument GLD shows, the momentum and money flow patterns are not constructive in the near term. The interplay between the dollar, Treasury yields and gold is always worth consideration and currently the interdependence is at an important juncture.
TRADE OPPORTUNITIES/SETUPS FOR THURSDAY DECEMBER 7, 2006
The patterns identified below should be considered as indicative of eventual price direction in forthcoming trading sessions. None of these setups should be seen as specifically opportune for the current trading session.
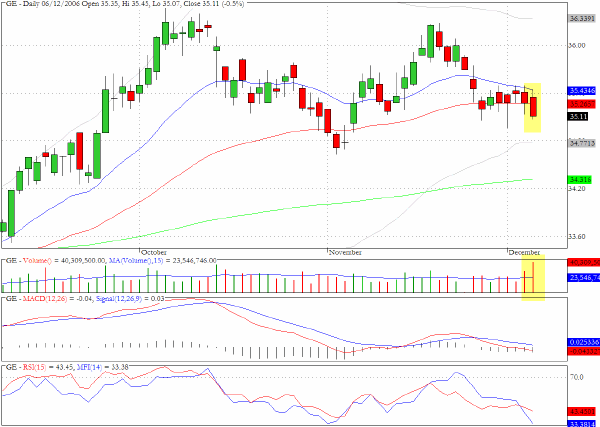
General Electric (GE) slipped below both its 20- and 50-day EMA's yesterday on heavy volume. There is evidence of a lower high in mid November following the previous high in early October and the MFI chart shows that buyers have been on strike during the last few weeks.
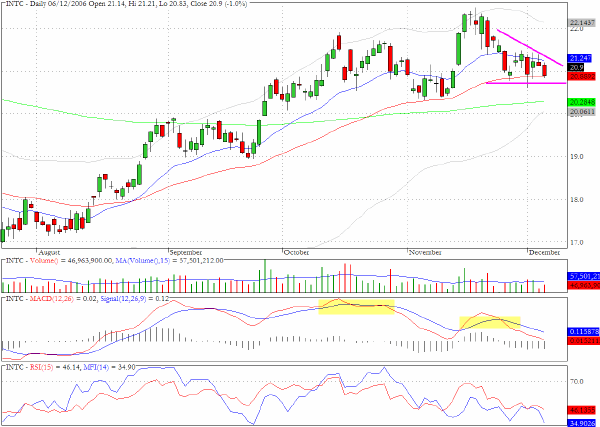
Intel (INTC) also looks technically weak and a probable descending wedge formation is apparent with negative divergences in both the MACD and MFI charts.
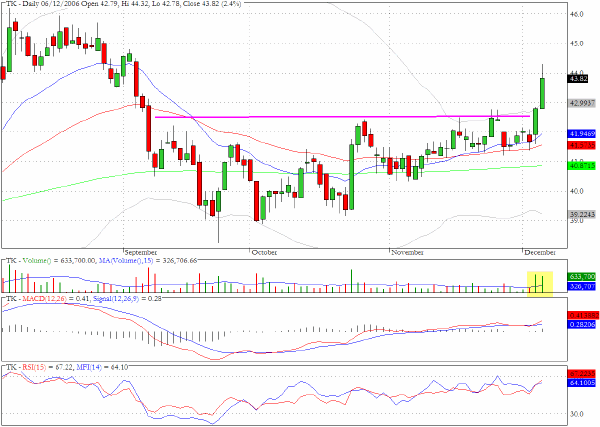
We noted in Wednesday's column that "Teekay Shipping (TK) looks poised for an upward breakout" and there was a 2.4% follow through in yesterday's trading
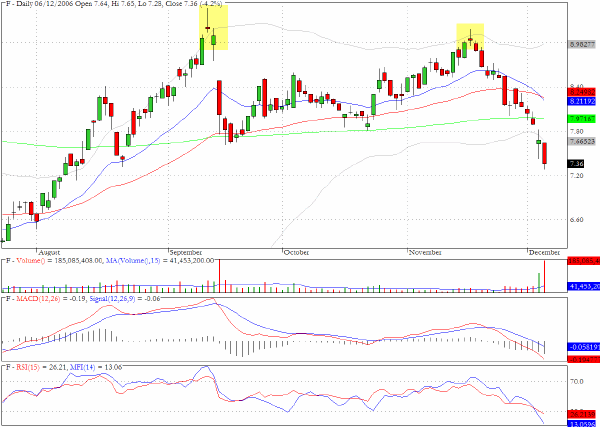
As noted above there are several problematic charts amongst the large cap stocks and Ford (F) is another one. The lower high has been highlighted and the stock appears to be lacking an obvious safety net that would arrest the decline until the $6.50 level is reached.
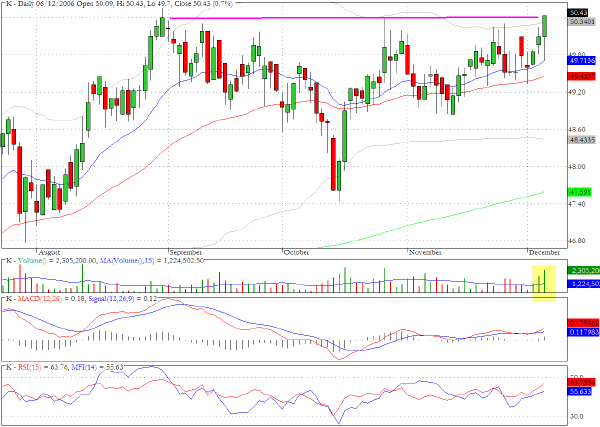
Kellogg (K) is poised for an upward breakout and could echo the recent behavior of some other defensive stocks such as KO.
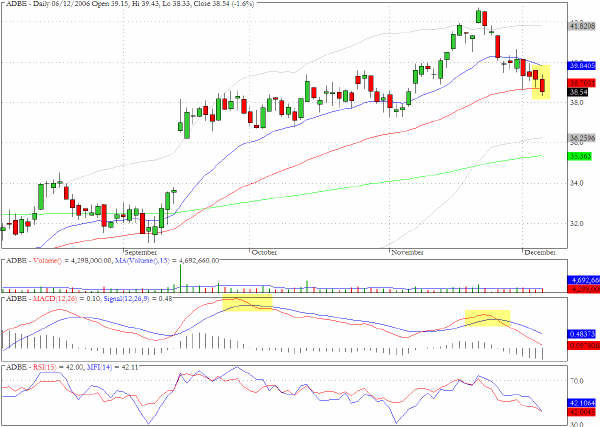
Adobe (ADBE) is another stock that is widely held by large institutions and looks quite vulnerable to a downturn. We have highlighted the very clear negative divergences in the MACD chart and the stock closed yesterday almost exactly at its 50-day EMA.
Clive Corcoran is the publisher of TradeWithForm.com, which provides daily analysis and commentary on the US stock market. He specializes in market neutral investing and and is currently working on a book about the benefits of trading with long/short strategies, which is scheduled for publication later this year.
Disclaimer
The purpose of this article is to offer you the chance to review the trading methodology, risk reduction strategies and portfolio construction techniques described at tradewithform.com. There is no guarantee that the trading strategies advocated will be profitable. Moreover, there is a risk that following these strategies will lead to loss of capital. Past results are no guarante of future results. Trading stocks and CFD's can yield large rewards, but also has large potential risks. Trading with leverage can be especially risky. You should be fully aware of the risks of trading in the capital markets. You are strongly advised not to trade with capital.