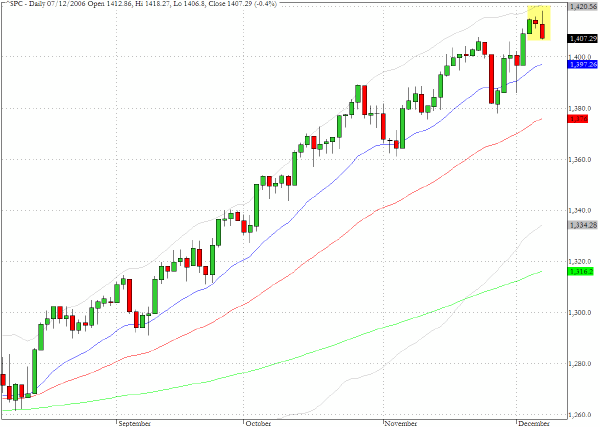
The S&P 500 cash index (^SPC) registered a new multi-year high in intraday trading yesterday but closed poorly. There are signs that some institutions may be locking in gains as we approach the year end, and as we commented here yesterday some widely held large caps are showing unmistakable signs of distribution.
Today's employment data will be closely analysed as always, and perhaps the bulls will find the excuse they need to shake out some of the index traders that are busily employed trying to pick the top. Our intermediate outlook is that the long side of the market is becoming harder to justify from the perspective of the reward/risk ratio.

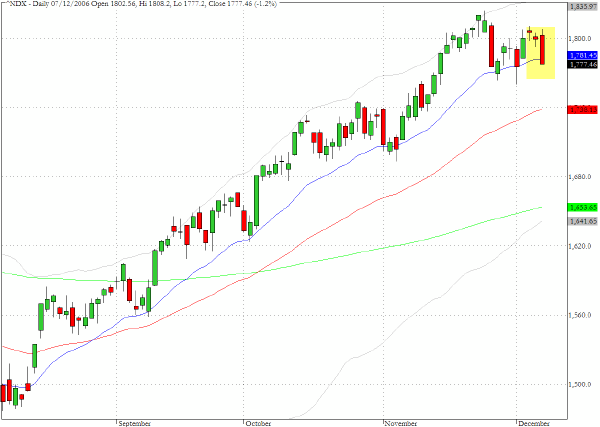
The Nasdaq 100 index (^NDX) declined by 1.2% and closed below the 20-day EMA raising the specter that a lower high may have been registered which could be precursor to a failure pattern. As we note below several charts including the ones for Oracle (ORCL) and Intel (INTC) are at key levels and we expect to get a better reading of the medium term prospects for the large tech stocks in the next few sessions.
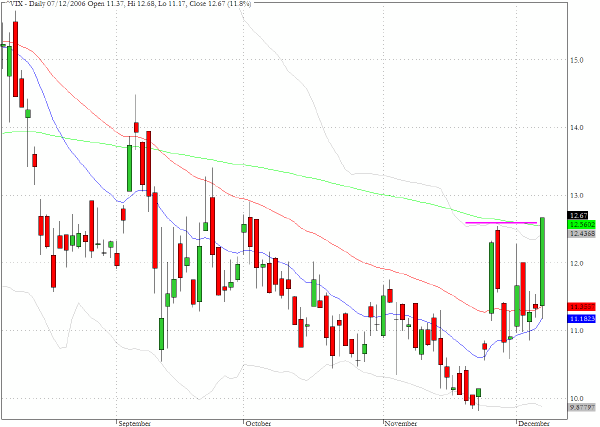
One of the more intriguing charts from yesterday is for the CBOE Volatility index (^VIX). The upsurge yesterday in the index, which closed above its recent high and also moved above the 200-day EMA, is even more remarkable in the sense that the actual declines in the indices were relatively modest for such a large movement in the market√Ę‚,¨‚"Ęs estimation of implied volatility.
TRADE OPPORTUNITIES/SETUPS FOR FRIDAY DECEMBER 8, 2006
The patterns identified below should be considered as indicative of eventual price direction in forthcoming trading sessions. None of these setups should be seen as specifically opportune for the current trading session.
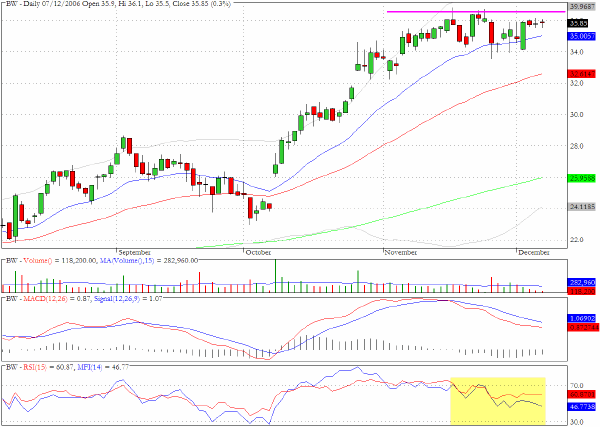
We pointed to Brush Engineered Materials (BW) earlier in the week and the resistance at $36 is becoming more evident and the momentum and money flow indicators are becoming more negative.
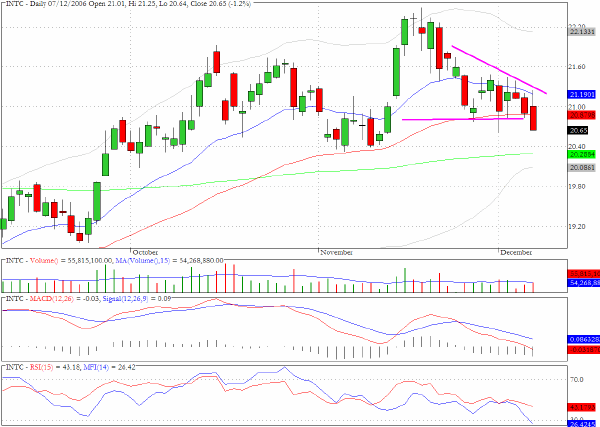
Intel (INTC) broke below the descending wedge formation that we discussed in yesterday's trading. It will be interesting to see whether the bulls can turn the situation around today and we may be able to gauge the extent to which the recent weakness is either genuine liquidation or the result primarily of the tactics of long/short funds.
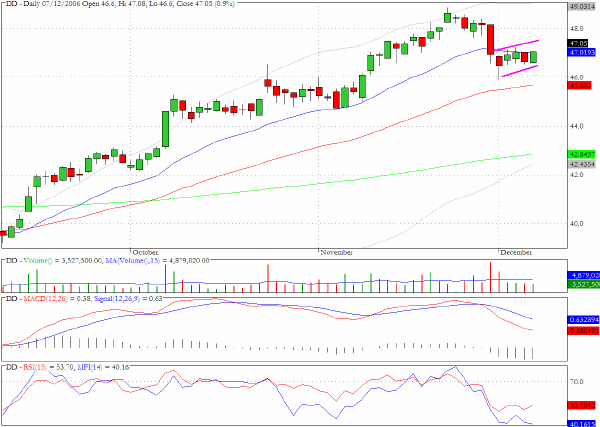
There is a bearish flag chart pattern for Dupont (DD)
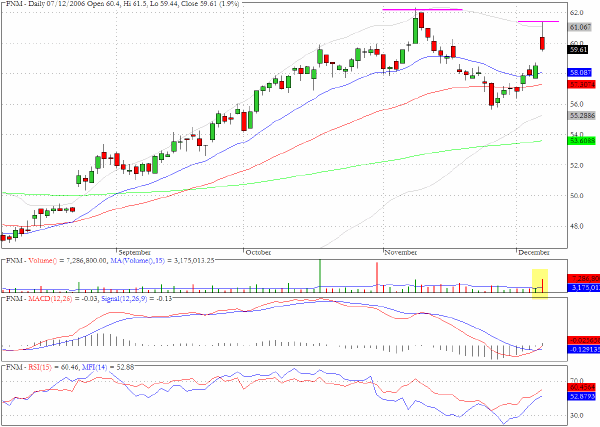
Yesterday's strong opening upward gap on the Fannie Mae chart (FNM) was substantially faded and there is again the possibility that a lower intermediate high may have been recorded.
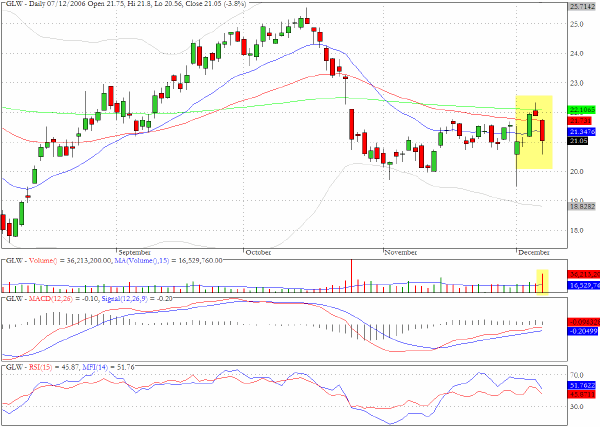
Corning Incorporated (GLW) is showing a classic reversal pattern as the stock penetrated above its moving averages earlier in the week and reversed yesterday to close below all three averages on twice the average daily volume
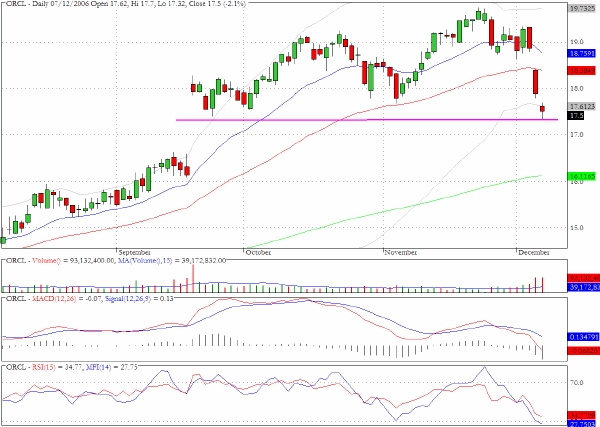
Oracle (ORCL) has dropped quickly during the last few sessions and has retraced all of the progress that had been made since the breakout in mid September. If support fails to arise this would be more evidence of serious technical deterioration for the large tech stocks.
Clive Corcoran is the publisher of TradeWithForm.com, which provides daily analysis and commentary on the US stock market. He specializes in market neutral investing and and is currently working on a book about the benefits of trading with long/short strategies, which is scheduled for publication later this year.
Disclaimer
The purpose of this article is to offer you the chance to review the trading methodology, risk reduction strategies and portfolio construction techniques described at tradewithform.com. There is no guarantee that the trading strategies advocated will be profitable. Moreover, there is a risk that following these strategies will lead to loss of capital. Past results are no guarante of future results. Trading stocks and CFD's can yield large rewards, but also has large potential risks. Trading with leverage can be especially risky. You should be fully aware of the risks of trading in the capital markets. You are strongly advised not to trade with capital.