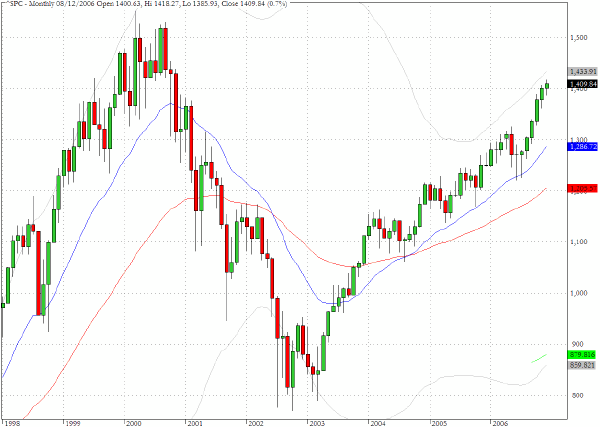
For a change, we decided to take a much longer term view of the S&P 500 index (^SPC) than we do normally. The monthly chart below covers the period since 1998. The highest daily close on the chart was 1527.46 reached on March 24, 2000 and the lowest daily close following that was 776.76 which was attained on October 9, 2002. The closing price last Friday was 1409.84 which means that the index has recovered more than 84% of the decline that occurred in the two and one half years after the March 2000 peak. It has taken the index more than four years to retrace most of its decline and based on Friday's close the index has just over eight percent further to go to challenge its all time high.

With the Russell 2000 and Dow Jones Industrials already in new all-time high territory, we suspect that the 1527 target in the S&P will prove to be a powerful attractor in the weeks to come.
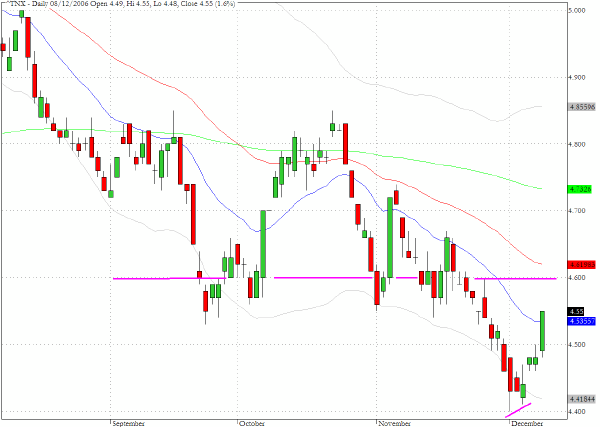
The 4.4% yield on the ten year Treasury note proved to be a pivotal level as we discussed in our recent commentary. The yield has backed up by more than fifteen basis points since touching the key level just over a week ago and now looks set to test the 4.6% level which also represents the 50-day EMA. Sentiment has abruptly reversed in recent sessions and Friday's data not only caused a jump in yields but also caused some re-thinking in the forex arena as the Euro took its largest tumble in several sessions.
In last Friday√Ę‚,¨‚"Ęs commentary we drew attention to the CBOE Volatility index (^VIX) and noticed the large movement on Thursday that seemed incommensurate with the action of the S&P 500 index that same day. The relative equanimity of Friday√Ę‚,¨‚"Ęs trading, following on from the employment data, allowed a retreat from Thursday√Ę‚,¨‚"Ęs big upward move but as the chart pattern makes clear there has been a rather pronounced change of trend since mid-November.

TRADE OPPORTUNITIES/SETUPS FOR MONDAY DECEMBER 11, 2006
The patterns identified below should be considered as indicative of eventual price direction in forthcoming trading sessions. None of these setups should be seen as specifically opportune for the current trading session.
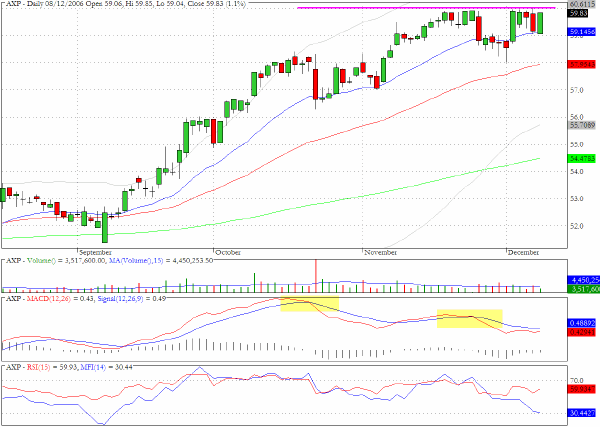
American Express (AXP) has encountered resistance over the last three weeks at the $60 level. The MACD chart reveals negative divergences and the chart pattern reflects the task that the bulls face in maintaining upward momentum for the remainder of the year after the strong progress that was made in the fall.
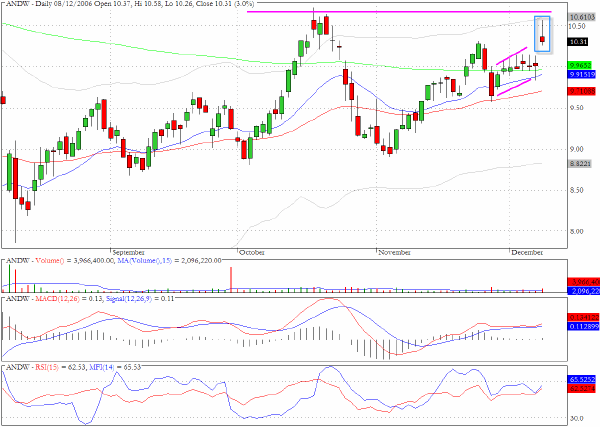
On Friday Andrew Corporation (ANDW) gapped up from a rising pullback channel but ran into resistance above $10.50 raising the possibility that a lower high to the mid October high may have been registered.
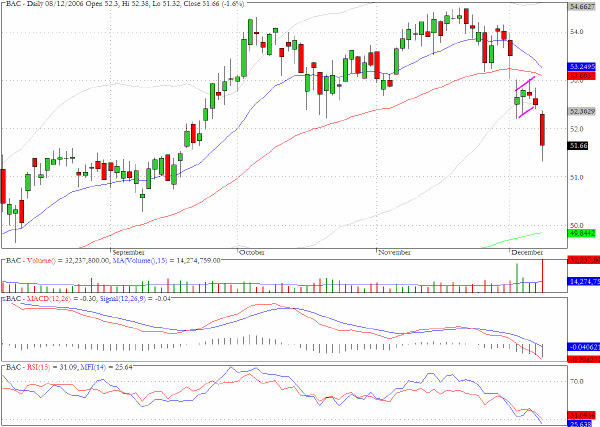
The chart for Bank of America (BAC) shows a classic two stage downward gap pattern interrupted by a short duration pullback pattern
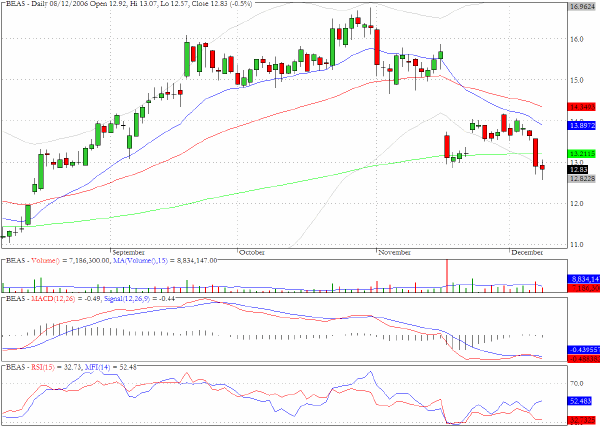
BEA Systems (BEAS) attempted a recovery pattern after declining to its 200-day EMA following its mid November plunge but now seems in danger of resuming its slide.
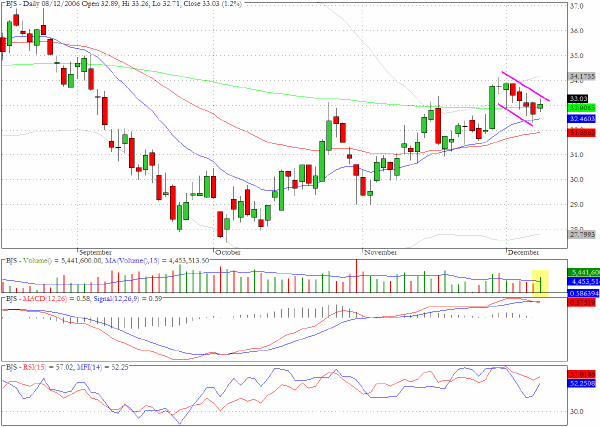
BJ Services (BJS) could be bracing for a further leg up.
Clive Corcoran is the publisher of TradeWithForm.com, which provides daily analysis and commentary on the US stock market. He specializes in market neutral investing and and is currently working on a book about the benefits of trading with long/short strategies, which is scheduled for publication later this year.
Disclaimer
The purpose of this article is to offer you the chance to review the trading methodology, risk reduction strategies and portfolio construction techniques described at tradewithform.com. There is no guarantee that the trading strategies advocated will be profitable. Moreover, there is a risk that following these strategies will lead to loss of capital. Past results are no guarante of future results. Trading stocks and CFD's can yield large rewards, but also has large potential risks. Trading with leverage can be especially risky. You should be fully aware of the risks of trading in the capital markets. You are strongly advised not to trade with capital.