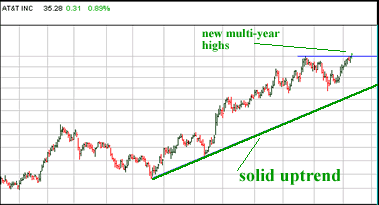
AT&T Inc. (T) is still on my bullish list. This stock has been very strong since Mid-May, and continues to rally. T recently pulled back slightly, and almost moved all the way back to initial uptrend support. Before it made its way back to the uptrend support line, the stock reversed at 32.50.
T has managed to put in new multi-year highs with today's move above 35. This previous resistance level will now act as support. RSI levels suggest the stock is over sold, but I continue to have a bullish outlook on T due to the recent price action.


Take a look at the 3-month daily bars chart below. As you can see, NAVTEQ Corporation (NVT) is sitting right on uptrend support. I would prefer to have seen the pull back occur on slightly lower volume. That said, the volume is not high enough to deter me.

Below I have posted a 6-month daily bars chart of iShares MSCI Mexico Index (EWW). As you can see, EWW has traded along a very nice 45 degree uptrend for the last 6 months. The ETF continues to make new all-time highs. Some people may look at this chart and think "over bought...time to short!" I'm a firm believer in trends, and will never bet against trend as strong as that of EWW.

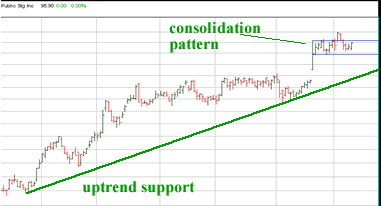
Let's take a look at the chart for Public Storage, Inc. (PSA). The stock has traded along uptrend support for quite some time. Recently PSA gapped up after a favorable earnings report. The stock has since entered a consolidation pattern. There is no attractive entry at the moment in PSA. I favor the long side due to the overall strength in the stock, but it is important to wait. Watch for new highs above 98 before considering a long position, or a break of consolidation support at 94 before considering a short position.

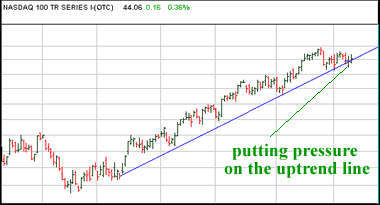
Nasdaq 100 Trust (QQQQ) is testing uptrend support in a big way. As you can see on the chart below, QQQQ is consolidating (trending sideways) right into the uptrend line. It spiked below uptrend support a few days ago, but managed to close above it.

Andy Swan is co-founder and head trader for DaytradeTeam.com. To get all of Andy's day trading, swing trading, and options trading alerts in real time, subscribe to a one-week, all-inclusive trial membership to DaytradeTeam by clicking here.