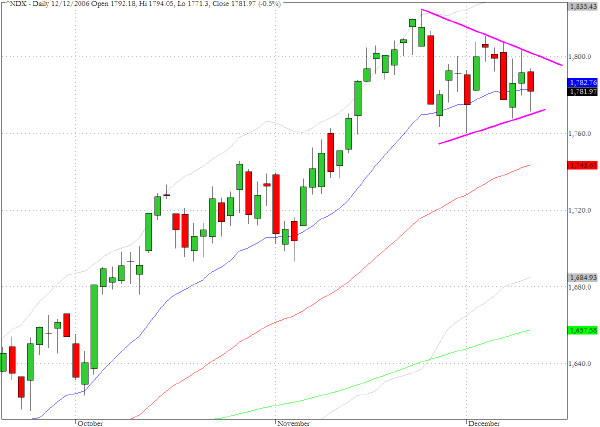
The Nasdaq 100 index (^NDX) closed yesterday at 1781 which coincides almost exactly with the 20-day EMA. As the chart clearly reveals the index is entering the apex of a triangular formation, and the pattern suggests that a directional breakout is to be expected soon.
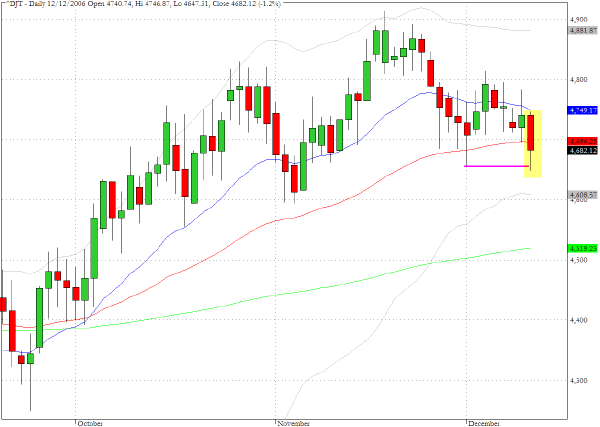
The Dow Jones Transportation index (^DJT) was the weakest among major indices yesterday and the chart pattern shows that the index has reached an important juncture.

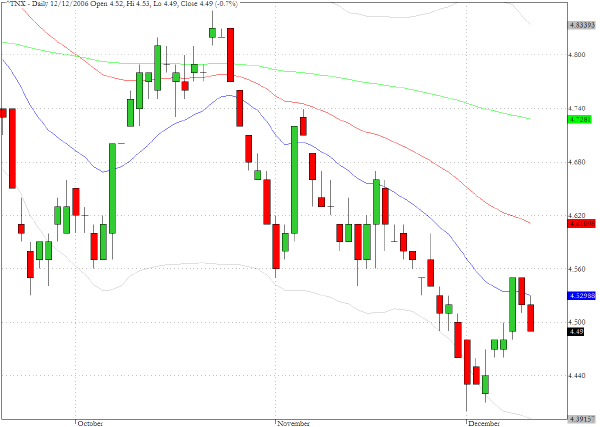
The only surprise about the FOMC announcement was the inclusion of the word "substantial" in the comment about the correction in the housing sector. Traders in the Treasury market took this as their cue for suspecting that the economy may still be weaker than certain data is suggesting and as yields declined the downward slope of the yield curve became just a little steeper
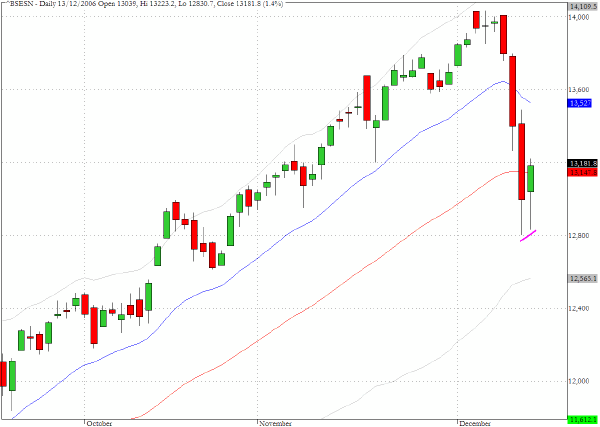
We included a chart for the Bombay Sensex index (^BSESN) yesterday before the completion of Tuesday's trading. We have now two additional days to show for this primary Indian exchange as Wednesday's trading has already completed. As can be seen the correction has been very swift and severe. The action in today's trading shows that the index mounted a rally after penetrating the 50-day EMA but as a result of the greatly increased volatility the near term direction remains uncertain.
The forthcoming book - Long/Short Market Dynamics - discusses how indices such as the Bombay Sensex are often useful as barometers for potential episodes of financial contagion. The proliferation of cross hedging strategies involving major global indices means that problematic volatility and liquidity conditions are often first manifested at the margins of the global financial system.
TRADE OPPORTUNITIES/SETUPS FOR WEDNESDAY DECEMBER 13, 2006
The patterns identified below should be considered as indicative of eventual price direction in forthcoming trading sessions. None of these setups should be seen as specifically opportune for the current trading session.
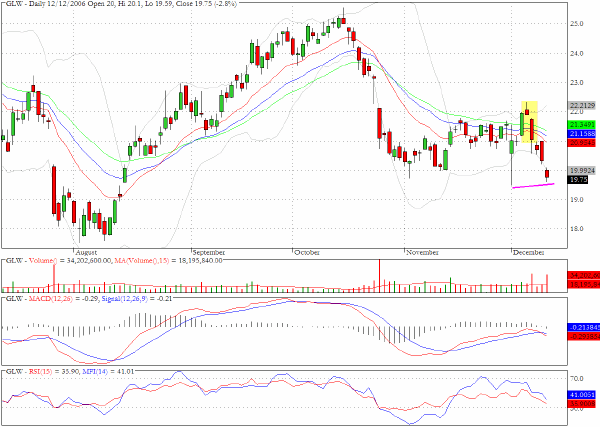
Last week we pointed to the reversal pattern that occurred on December 7 for Corning (GLW) and since then the stock has continued to decline.
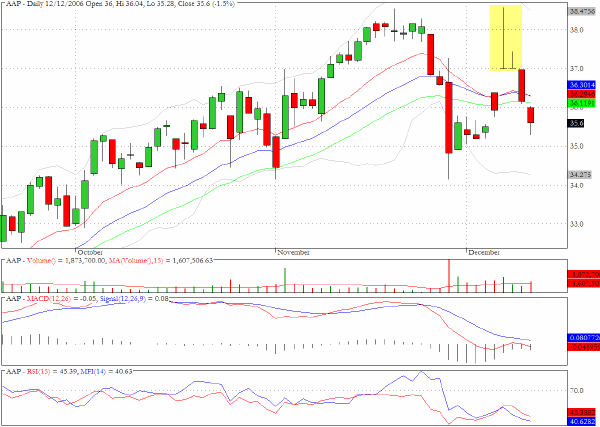
The chart for Advanced Auto Parts (AAP) reveals an interesting variation on the bearish ascending channel formation. We have highlighted the very unusual candlestick that occurred on December 7, which shows a very long upper tail and a Doji pattern that would have stopped out most of the short sellers that had been attracted by the very long red candle from late November. However after flushing out the shorts and confusing most traders the weakness has resumed
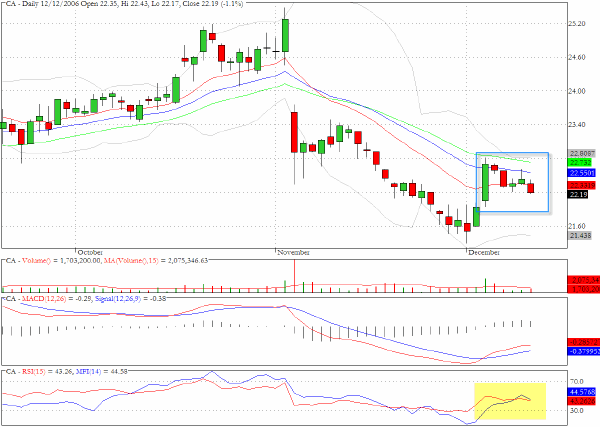
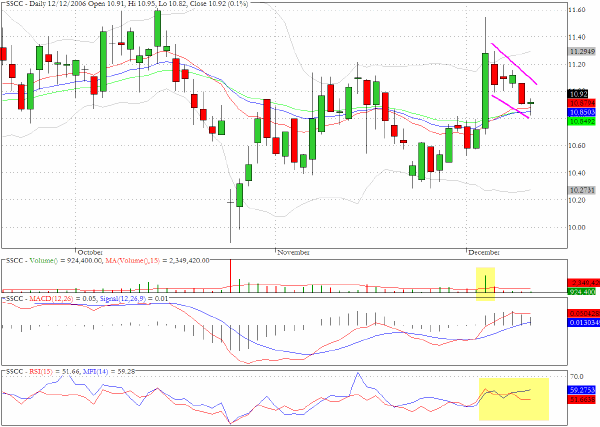
Computer Associates (CA) could continue its recovery pattern as a bullish flag pattern has formed.
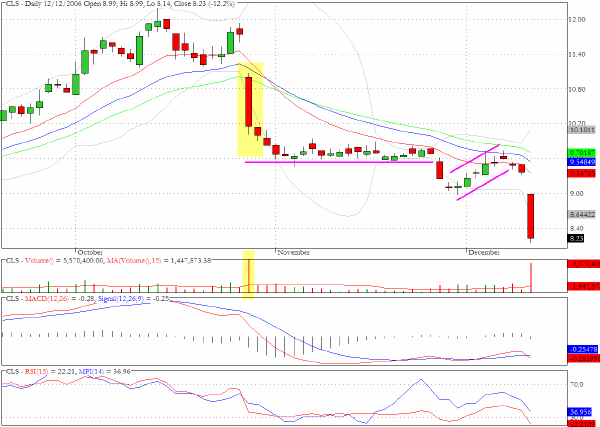
Another unorthodox variation on a bearish channel formation is to be found in the chart for Celestica (CLS).
Ross Stores (ROST) has a well defined bull flag formation.
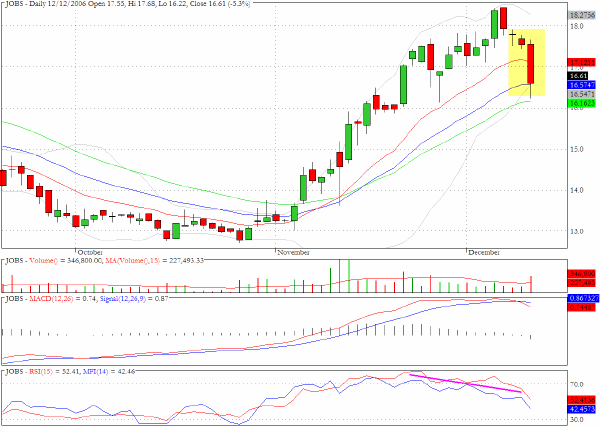
The chart for 51Job (JOBS) provides a good illustration of negative money flow divergences.
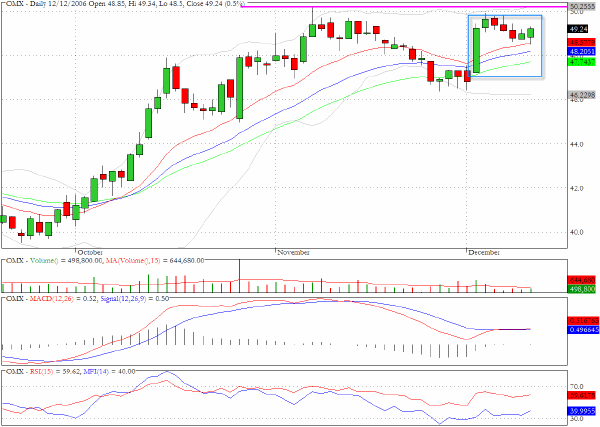
OfficeMax (OMX) could be bracing for an attempt to break through the $50 barrier.
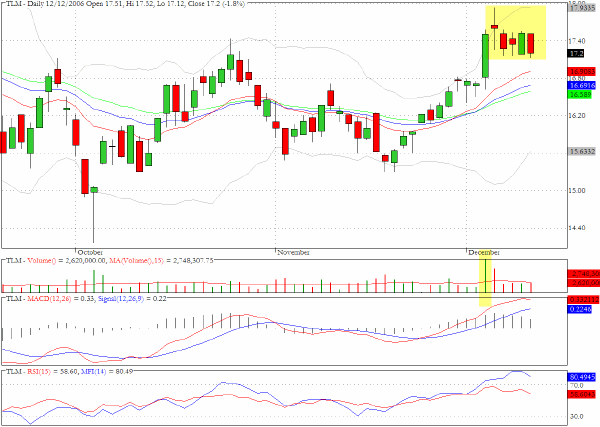
Talisman (TLM) in the energy complex has been consolidating since the long green candlestick on heavy volume from December 5.
Clive Corcoran is the publisher of TradeWithForm.com, which provides daily analysis and commentary on the US stock market. He specializes in market neutral investing and and is currently working on a book about the benefits of trading with long/short strategies, which is scheduled for publication later this year.
Disclaimer
The purpose of this article is to offer you the chance to review the trading methodology, risk reduction strategies and portfolio construction techniques described at tradewithform.com. There is no guarantee that the trading strategies advocated will be profitable. Moreover, there is a risk that following these strategies will lead to loss of capital. Past results are no guarante of future results. Trading stocks and CFD's can yield large rewards, but also has large potential risks. Trading with leverage can be especially risky. You should be fully aware of the risks of trading in the capital markets. You are strongly advised not to trade with capital.