NASDAQ Commentary
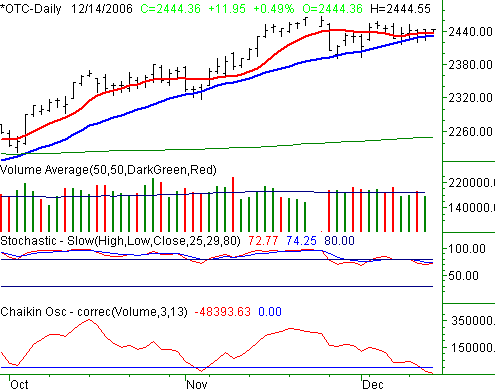
On Wednesday, the NASDAQ Composite made a very slight gain of 0.81 points to end the session at 2432.41. While it closed 0.03% higher for the day, on a weekly basis, it was still down by 0.2% (-4.95 points). Of course with today's (Thursday's) action, the composite has added 11.95 points (or +0.49%) to that total.
We'd be kidding ourselves if we said the 20-day moving average line (blue) wasn't strong support, since it clearly is. In fact, it's been one of the key bullish factors over the last four months - including today. The question is, can it overcome some of the more esoteric indicators like stochastics and the Chaikin line.

Technically speaking, the we went into 'stochastic sell' mode on the 12th, when both lines fell back under the 80 'overbought' threshold. However, we may be on track to unwind that sell signal now that both of those lines have curled higher again.
The bigger challenge lies in the Chaikin line. It crossed under zero a few days ago, verifying that the volume trend has indeed tipped in favor of the bears, despite the NASDAQ's higher closes. We can close the disparity gap here by acknowledging that the Chaikin line is a 'bigger picture' tool that can take a few days to fully sink in; the index can still flop around in the meantime.
With all that in mind, we still have to sit with the bulls, as they seem to have the momentum. However, we still think support at the 20-day line is critical, especially when we have a couple of other bearish red flags in place. The 20-day average is currently at 2433.
NASDAQ Chart

S&P 500 Commentary
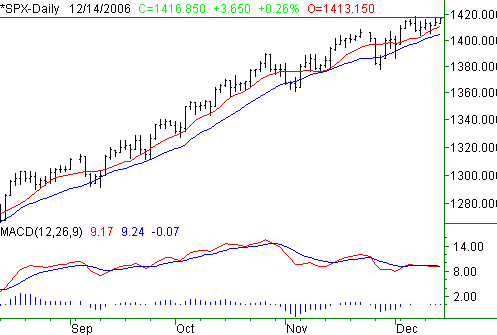
As of yesterday's close, the S&P 500 was at 1413.20, after it gained 1.65 points (-0.12%) on Wednesday. The move further extended the SPX's weekly gain so far, by half. Yes, the S&P 500 was 3.35 points (+0.24%) for the week at the end of Wednesday's trading. Today's action thus far has added about that same amount to the weekly gains, the S&P 500 is up 0.26% today, or 3.65 points, currently trading at 1416.85.
As vulnerable as the market is right now, we see one primary catalyst that could continue to drive the seasonal bullishness -- a break to yet another new 52-week high. The index hit 1418.25 in early December; today's high so far is 1416.85. Given that we're still seeing reasonably strong support at the 10- and 20-day moving average lines, the benefit of the trend momentum still has to be given to the bulls. But all the same, we'd like to see that minor hurdle leaped first, since most traders are probably watching the same.
In the meantime, keep any eye on the 10- and 20-day lines at 1410 and 1404, respectively. Like we said, both are still support, but neither is doing as good of a job with that as they were a few weeks ago.
Special Alert: Moments after writing this commentary, the SPX did manage to break past 1418. If it can stay above that level on a closing basis, the bullish argument will be even further enhanced.
S&P 500 Chart

Russell 2000 Commentary
As promised, we're going to keep any eye on the Russell 2000 for a while, as we feel it's an important 'small cap' dynamic to monitor. We've temporarily substituted this chart for the Dow's.
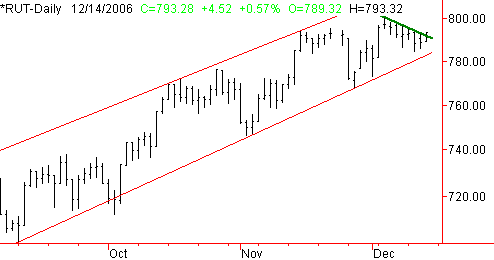
In any case, the Russell 2000 pretty much mirrored the rest of the market's mediocrity on Wednesday, closing 0.04% higher to end the day at 788.76 (+0.34 points). For the week, however, that still means a loss of 3.80 points, or -0.48%, the worst of all the indices. Today's session is a positive one though, with the small cap index up 0.57%, or +4.52 points.
For the Russell, it's a tale of two trends. The overall bullish channel we pointed out last week is still intact, with the lower edge of it currently at 783. Simultaneously, we've seen a short-term resistance line develop (green) thanks to six consecutive lower highs. That resistance line is currently at 791. Today's high of 793.32 (so far), though, is a clear threat to that resistance, and just a hair under yesterday's high. We'd keep a close eye on those levels today.
Of the two, the support line is the one we're far more interested in; if it breaks, the Russell 2000 is more likely to undergo a correction. However, the resistance line has already been breached, so we think the odds are good that it will set up a short-term bullish rally - perhaps back up to the upper line of the bullish channel (framed in red). With that being said, a strong close today would confirm the stance. A weak close (back under the green resistance line) would signal that today's rally was errant, and that the momentum was still to the downside.
Russell 2000 Chart

Price Headley is the founder and chief analyst of BigTrends.com.