If we were to ask any investor what a "perfect market" would look like, it would probably be described as a perpetual environment that has little or no change, going in one direction, steadily to the upside. Is this possible? It would be hard to think that it is, and yet, today in December 2006, the equity market, as measured by the S&P 500, is very close to that, since its swing low point in July 2006.
Out of the last 21 weeks of trading, the S&P 500 made higher-highs on all but only 3 weekly bars, which is remarkable. Although we had anticipated and been on the right side of much of that ascent, it's the last 2 weeks that has served as yet another reminder that the impossible is always happening in the stock market, and that it can rise (or fall) to much greater levels than most can even imagine. That includes me, and I like to think that especially in the case of the Stock Market, my imagination can go pretty far.

As active traders and investors, we accustom ourselves to change and changes in price behavior because we have to. Once in a while, the market will experience a period of prolonged repetition that extends beyond the tolerance of most, as if hearing the very same song over and over, and this can be quite a humbling experience. In the case of the S&P 500, the relentless ascent with barely a hiccup has been awesome, and as I write this, it trades at multi-year highs. While this is not the case with the Nasdaq, which has been struggling since the Thanksgiving break, the power of the S&P 500 has been holding the fort for the equity markets. As mentioned here many times in the past, this is a trend that we must respect on all short-term operations, even if it conflicts with our intermediate-term viewpoint, which favors the bear side.
As these short-term trends conflict with our expectations of the larger time frames, we just "go with the flow" on the markets, and apply our analysis accordingly. Let's take a look at the charts:

Chart Notations:
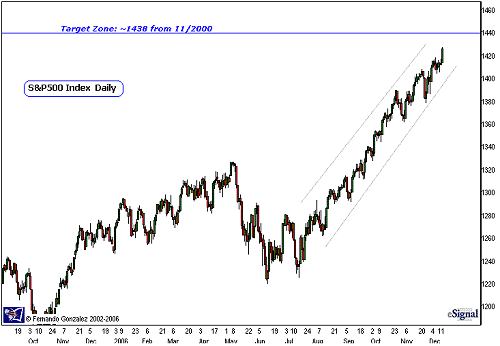
- The daily chart of the S&P 500 above addresses the short-term time horizon
- The upward channel (represented by the gray lines) has been an awesome one since the swing low point in July.
- In September, we targeted a swing move to 1384, which has now been hit, exceeded and re-tested.
- At this point, the market is underway towards our next target zone at 1438, where it is likely to encounter stiff resistance. This mark is derived from a high-point in November 2000 (check your weekly or monthly charts).
- As a general short-term plan, for everyday that the market trades above prior day high and above 1407 (prior swing high), let's look for the market to make its way towards our 1438 target.
- As in most cases, we avoid bull-side operations if market is trading below the prior day low, particularly now that we have intermediate-term sell signal in play.

Chart Notations:
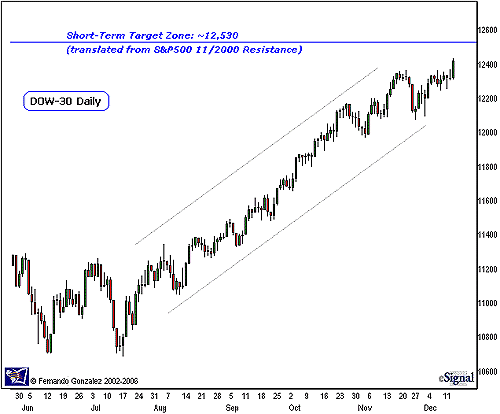
- The daily chart of the Dow-30 above addresses the short-term time horizon.
- Since the Dow is trading at all-time highs, we do not have the luxury of past history to develop reliable support/resistance and target levels. At this point, what we have done is take our 1438 resistance mark (see prior S&P 500 chart) and scaled or "translated" it to the Dow. Translating support and resistance from related markets is a very effective method to derive next orders of resistance for markets that are trading in "uncharted" territory (all-time high, or all-time low).
- That target zone in the S&P 500 translates to about 12,530 in the Dow. The same notations as in the previous chart apply here.

Chart Notations:
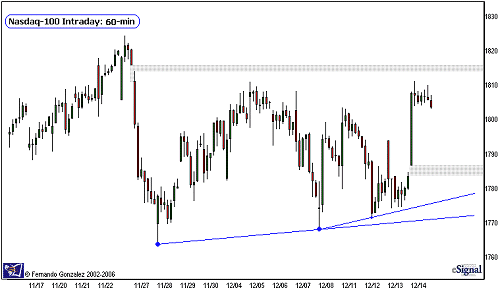
- The hourly chart of the Nasdaq-100 above addresses the very short-term time horizon (up to 10 TD).
- Notice that the Nasdaq has been struggling since late November, has gone into a range, and is now at the top of that range. Note there is an open gap (upper gray area) which serves as a resistance zone that is in play. Sustained trade above the gap threatens the high point in the chart, and puts multi-year highs into play.
- On the downside, there are a few key support points, between another open gap and a couple of trendlines. Day and short-term swing traders should keep an eye on these levels for downside price action as well.
Fernando Gonzalez is in his 10th year as an active trader, technical analyst and content contributor to the active trading community and a long list of popular financial media. Online Trading Academy trading knowledge...your most valuable form of capital.